Mis à jour
Simple & Clean ORB
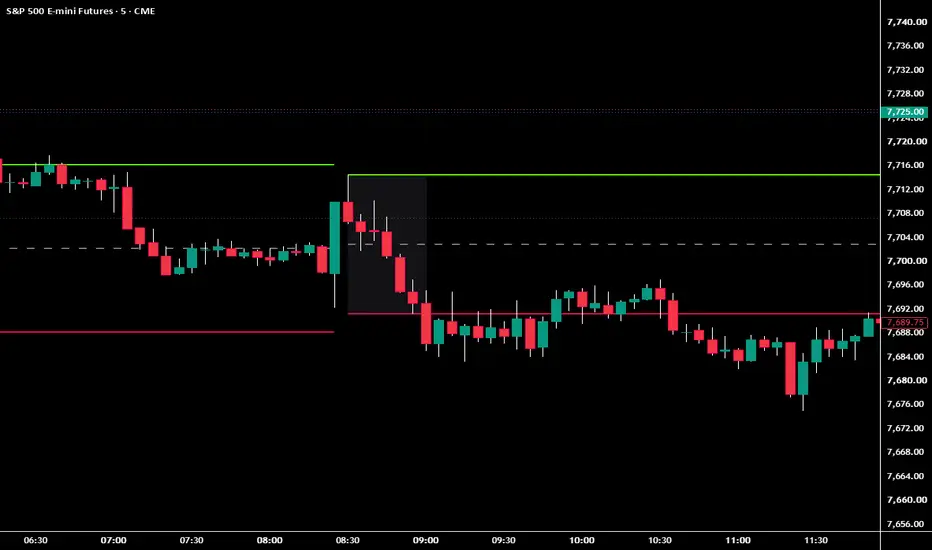
Simple & Clean ORB is a lightweight Opening Range Breakout indicator designed for traders who want the core ORB levels without unnecessary clutter.
The indicator marks the Opening Range High, Opening Range Low, and optional Midpoint, then extends those levels forward so you can clearly see when price breaks out, rejects, retests, or trades back through the opening range.
The goal is simple: give you a clean price-action framework and let the chart do the talking.
What Is an Opening Range?
The Opening Range is the high and low created during a selected period of time after a session begins.
For example, if you use:
Start Time: 8:30 AM
Range Length: 30 Minutes
The indicator records the highest high and lowest low between 8:30 AM and 9:00 AM.
Once the range is complete, those levels become important reference points for the rest of the trading session.
Traders commonly watch these levels for:
Why I Created Simple & Clean ORB
There are many Opening Range indicators available, but some include signals, targets, dashboards, colors, alerts, and other features that can make a chart feel crowded.
Simple & Clean ORB was built around one idea:
Show the important ORB levels clearly and let the trader interpret the price action.
Instead of telling you when to buy or sell, the indicator gives you the structure.
You decide how price is behaving around that structure.
Main Features
Custom Opening Range Time
Choose when your Opening Range begins and how long the range lasts.
Available range lengths include:
You can also define your own custom opening-range session.
This allows the indicator to be used with different markets and trading styles.
Custom Time Zones
The Opening Range can be calculated using your preferred time zone.
This is especially useful when trading markets whose opening times may be different from your local time.
The indicator also supports major U.S. market time zones and UTC offsets.
For U.S. index futures, traders may find America/Chicago convenient because it automatically adjusts for daylight-saving time.
Fully Customizable ORB High
The Opening Range High can be customized independently.
You can change:
Fully Customizable ORB Low
The Opening Range Low has its own independent settings.
You can change:
This allows the upper and lower boundaries to be visually different if desired.
Optional ORB Midpoint
The indicator can also display the 50% midpoint of the Opening Range.
The midpoint often acts as an important intraday reference level.
Price moving above or below the midpoint can help traders understand which side of the range currently has greater control.
The midpoint can be:
Historical Opening Ranges
You can choose whether previous Opening Ranges remain visible.
With historical data enabled, each ORB remains on the chart until the next Opening Range begins.
This can be useful when studying how price interacts with previous ranges.
If you prefer an extremely clean chart, historical ranges can be disabled.
How to Trade With the ORB
The ORB should not necessarily be treated as an automatic breakout signal.
The range is better thought of as a market structure framework.
Once the range is established, watch how price behaves around the High, Low, and Midpoint.
Bullish Breakout
A bullish scenario may develop when price:
The ORB High may then transition from resistance into support.
Bearish Breakout
A bearish scenario may develop when price:
The ORB Low may then transition from support into resistance.
Failed Breakout
Some of the most useful ORB information comes from breakouts that fail.
For example:
Price breaks above the ORB High but quickly returns inside the range.
This can signal that buyers were unable to maintain control.
The same concept applies to failed breakdowns below the ORB Low.
These situations can help reveal:
The Midpoint
The ORB midpoint can also provide useful market information.
If price consistently holds above the midpoint, the upper portion of the range may have greater control.
If price remains below the midpoint, the lower portion of the range may be dominant.
Repeated movement through the midpoint can also suggest that the market is rotating rather than trending.
Example Setup for U.S. Index Futures
A commonly used setup for U.S. index futures is:
Start Time: 8:30 AM Central
Opening Range: 30 Minutes
Time Zone: America/Chicago
This creates an Opening Range from:
8:30 AM – 9:00 AM Central Time
Traders can then monitor the ORB High, Low, and Midpoint throughout the remainder of the session.
Markets
Although ORB concepts are commonly associated with futures and stocks, the indicator can be used on any market where a meaningful session or time period can be defined.
Examples include:
The appropriate Opening Range will depend on the market being traded.
The Philosophy Behind Simple & Clean ORB
The purpose of this indicator is not to predict the market.
It is to create a clearly defined area where traders can observe the battle between buyers and sellers.
Once the Opening Range is established, the market usually does one of three things:
Break above it.
Break below it.
Remain trapped inside it.
That simple framework can provide a surprisingly powerful way to organize price action.
Simple & Clean ORB keeps that framework visible without filling the chart with unnecessary information.
Sometimes the best trading tool isn't the one that adds more.
It's the one that makes the important levels easier to see.
The indicator marks the Opening Range High, Opening Range Low, and optional Midpoint, then extends those levels forward so you can clearly see when price breaks out, rejects, retests, or trades back through the opening range.
The goal is simple: give you a clean price-action framework and let the chart do the talking.
What Is an Opening Range?
The Opening Range is the high and low created during a selected period of time after a session begins.
For example, if you use:
Start Time: 8:30 AM
Range Length: 30 Minutes
The indicator records the highest high and lowest low between 8:30 AM and 9:00 AM.
Once the range is complete, those levels become important reference points for the rest of the trading session.
Traders commonly watch these levels for:
- Breakouts
- Breakout retests
- Rejections
- Failed breakouts
- Support and resistance
- Trend continuation
- Range rotation
- Market structure confirmation
Why I Created Simple & Clean ORB
There are many Opening Range indicators available, but some include signals, targets, dashboards, colors, alerts, and other features that can make a chart feel crowded.
Simple & Clean ORB was built around one idea:
Show the important ORB levels clearly and let the trader interpret the price action.
Instead of telling you when to buy or sell, the indicator gives you the structure.
You decide how price is behaving around that structure.
Main Features
Custom Opening Range Time
Choose when your Opening Range begins and how long the range lasts.
Available range lengths include:
- 2 Minutes
- 3 Minutes
- 5 Minutes
- 8 Minutes
- 10 Minutes
- 15 Minutes
- 30 Minutes
- 45 Minutes
- 1 Hour
- 2 Hours
- 3 Hours
- 4 Hours
- 8 Hours
You can also define your own custom opening-range session.
This allows the indicator to be used with different markets and trading styles.
Custom Time Zones
The Opening Range can be calculated using your preferred time zone.
This is especially useful when trading markets whose opening times may be different from your local time.
The indicator also supports major U.S. market time zones and UTC offsets.
For U.S. index futures, traders may find America/Chicago convenient because it automatically adjusts for daylight-saving time.
Fully Customizable ORB High
The Opening Range High can be customized independently.
You can change:
- Color
- Line thickness
- Solid line
- Dashed line
- Dotted line
Fully Customizable ORB Low
The Opening Range Low has its own independent settings.
You can change:
- Color
- Line thickness
- Solid line
- Dashed line
- Dotted line
This allows the upper and lower boundaries to be visually different if desired.
Optional ORB Midpoint
The indicator can also display the 50% midpoint of the Opening Range.
The midpoint often acts as an important intraday reference level.
Price moving above or below the midpoint can help traders understand which side of the range currently has greater control.
The midpoint can be:
- Turned on or off
- Given its own color
- Given its own thickness
- Displayed as solid, dashed, or dotted
Historical Opening Ranges
You can choose whether previous Opening Ranges remain visible.
With historical data enabled, each ORB remains on the chart until the next Opening Range begins.
This can be useful when studying how price interacts with previous ranges.
If you prefer an extremely clean chart, historical ranges can be disabled.
How to Trade With the ORB
The ORB should not necessarily be treated as an automatic breakout signal.
The range is better thought of as a market structure framework.
Once the range is established, watch how price behaves around the High, Low, and Midpoint.
Bullish Breakout
A bullish scenario may develop when price:
- Breaks above the ORB High
- Holds above the range
- Shows increased momentum
- Retests the ORB High successfully
- Continues forming higher highs and higher lows
The ORB High may then transition from resistance into support.
Bearish Breakout
A bearish scenario may develop when price:
- Breaks below the ORB Low
- Holds below the range
- Shows increasing downside momentum
- Retests the ORB Low and rejects
- Continues forming lower highs and lower lows
The ORB Low may then transition from support into resistance.
Failed Breakout
Some of the most useful ORB information comes from breakouts that fail.
For example:
Price breaks above the ORB High but quickly returns inside the range.
This can signal that buyers were unable to maintain control.
The same concept applies to failed breakdowns below the ORB Low.
These situations can help reveal:
- Rejection
- Trapped traders
- Weak momentum
- Liquidity sweeps
- False breakouts
The Midpoint
The ORB midpoint can also provide useful market information.
If price consistently holds above the midpoint, the upper portion of the range may have greater control.
If price remains below the midpoint, the lower portion of the range may be dominant.
Repeated movement through the midpoint can also suggest that the market is rotating rather than trending.
Example Setup for U.S. Index Futures
A commonly used setup for U.S. index futures is:
Start Time: 8:30 AM Central
Opening Range: 30 Minutes
Time Zone: America/Chicago
This creates an Opening Range from:
8:30 AM – 9:00 AM Central Time
Traders can then monitor the ORB High, Low, and Midpoint throughout the remainder of the session.
Markets
Although ORB concepts are commonly associated with futures and stocks, the indicator can be used on any market where a meaningful session or time period can be defined.
Examples include:
- Futures
- Stocks
- Forex
- Indices
- Cryptocurrency
The appropriate Opening Range will depend on the market being traded.
The Philosophy Behind Simple & Clean ORB
The purpose of this indicator is not to predict the market.
It is to create a clearly defined area where traders can observe the battle between buyers and sellers.
Once the Opening Range is established, the market usually does one of three things:
Break above it.
Break below it.
Remain trapped inside it.
That simple framework can provide a surprisingly powerful way to organize price action.
Simple & Clean ORB keeps that framework visible without filling the chart with unnecessary information.
Sometimes the best trading tool isn't the one that adds more.
It's the one that makes the important levels easier to see.
Notes de version
Added: Highlighted box of the candles that made the ORB.
Clause de non-responsabilité
Les informations et publications ne sont pas destinées à être, et ne constituent pas, des conseils ou recommandations financiers, d'investissement, de trading ou autres fournis ou approuvés par TradingView. Pour en savoir plus, consultez les Conditions d'utilisation.
Clause de non-responsabilité
Les informations et publications ne sont pas destinées à être, et ne constituent pas, des conseils ou recommandations financiers, d'investissement, de trading ou autres fournis ou approuvés par TradingView. Pour en savoir plus, consultez les Conditions d'utilisation.