OPEN-SOURCE SCRIPT
Mis à jour Hull VWMA + THMA
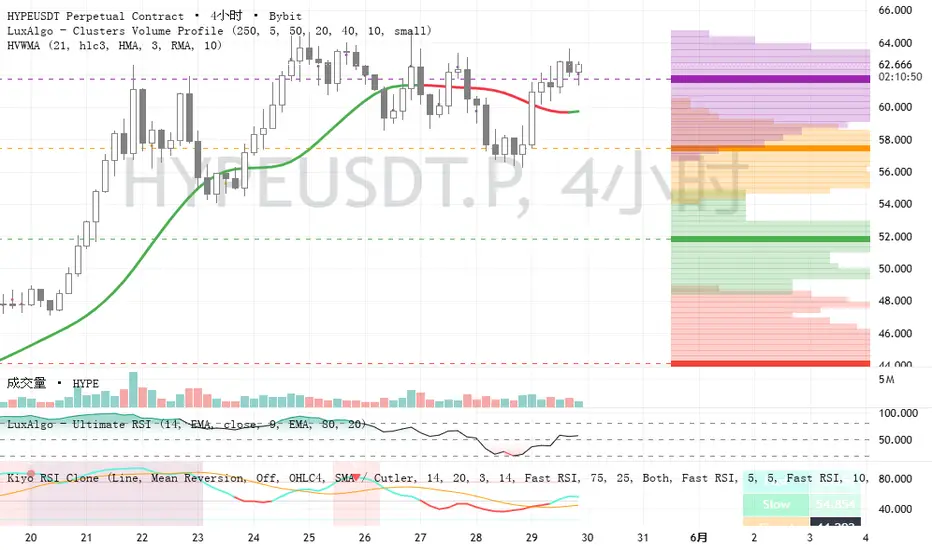
Hull VWMA + THMA
Hull VWMA + THMA is a volume-weighted Hull-style moving average designed to combine the responsiveness of Hull Moving Average logic with volume-adjusted price weighting.
Instead of applying the Hull calculation to a standard WMA, this indicator uses a volume-weighted WMA structure, where price movement is adjusted by trading volume. This helps the moving average respond more strongly to price action that occurs with higher volume, while reducing the influence of lower-volume moves.
The indicator supports two Hull variations:
HMA Mode
Uses a volume-weighted Hull Moving Average calculation for a smooth and responsive trend-following line.
THMA Mode
Uses a faster THMA-style Hull variation, designed to react more aggressively to short-term price changes.
The line changes color based on its slope:
Green = the average is rising
Red = the average is falling
This makes it easy to visually identify trend direction, momentum shifts, and potential continuation or reversal areas.
Features
Volume-weighted Hull Moving Average calculation
Optional THMA variation for faster response
Optional geometric mode using log-price transformation
Adjustable source and length
Optional line smoothing with EMA, RMA, or WMA
Dynamic color based on trend direction
Works directly on the price chart
How to Use
This indicator can be used as a trend filter, dynamic support/resistance reference, or momentum direction tool.
Common usage ideas:
Price above the line may indicate bullish trend conditions
Price below the line may indicate bearish trend conditions
A green line suggests upward momentum
A red line suggests downward momentum
Slope changes may help identify early trend shifts
THMA mode may be useful for shorter-term or more reactive trading styles
HMA mode may be preferable for smoother trend following
Inputs
Length
Controls the calculation period. Lower values make the line faster; higher values make it smoother.
Source
Selects the price source used in the calculation.
Hull Variation
Choose between HMA and THMA modes.
Geometric
Applies a logarithmic transformation before calculation and converts the result back afterward. This may be useful for assets with large percentage-based moves.
Line Smoothing
Optional smoothing can be applied using EMA, RMA, or WMA.
Line Smoothing Length
Controls the strength of the optional smoothing.
Notes
This indicator is intended to help visualize volume-adjusted trend direction and momentum. It should not be used as a standalone trading system. Always combine it with proper risk management and additional market analysis.
Hull VWMA + THMA is a volume-weighted Hull-style moving average designed to combine the responsiveness of Hull Moving Average logic with volume-adjusted price weighting.
Instead of applying the Hull calculation to a standard WMA, this indicator uses a volume-weighted WMA structure, where price movement is adjusted by trading volume. This helps the moving average respond more strongly to price action that occurs with higher volume, while reducing the influence of lower-volume moves.
The indicator supports two Hull variations:
HMA Mode
Uses a volume-weighted Hull Moving Average calculation for a smooth and responsive trend-following line.
THMA Mode
Uses a faster THMA-style Hull variation, designed to react more aggressively to short-term price changes.
The line changes color based on its slope:
Green = the average is rising
Red = the average is falling
This makes it easy to visually identify trend direction, momentum shifts, and potential continuation or reversal areas.
Features
Volume-weighted Hull Moving Average calculation
Optional THMA variation for faster response
Optional geometric mode using log-price transformation
Adjustable source and length
Optional line smoothing with EMA, RMA, or WMA
Dynamic color based on trend direction
Works directly on the price chart
How to Use
This indicator can be used as a trend filter, dynamic support/resistance reference, or momentum direction tool.
Common usage ideas:
Price above the line may indicate bullish trend conditions
Price below the line may indicate bearish trend conditions
A green line suggests upward momentum
A red line suggests downward momentum
Slope changes may help identify early trend shifts
THMA mode may be useful for shorter-term or more reactive trading styles
HMA mode may be preferable for smoother trend following
Inputs
Length
Controls the calculation period. Lower values make the line faster; higher values make it smoother.
Source
Selects the price source used in the calculation.
Hull Variation
Choose between HMA and THMA modes.
Geometric
Applies a logarithmic transformation before calculation and converts the result back afterward. This may be useful for assets with large percentage-based moves.
Line Smoothing
Optional smoothing can be applied using EMA, RMA, or WMA.
Line Smoothing Length
Controls the strength of the optional smoothing.
Notes
This indicator is intended to help visualize volume-adjusted trend direction and momentum. It should not be used as a standalone trading system. Always combine it with proper risk management and additional market analysis.
Notes de version
ChangelogAdded HMA / THMA selection under Hull Variation.
Added a volume-weighted THMA variant based on the Hull Suite THMA formula.
Added optional Line Smoothing with EMA, RMA, and WMA choices.
Added Line Smoothing Length to control how smooth or responsive the line is.
Added TradingView alert conditions:
- HVWMA Turns Green
- HVWMA Turns Red
- HVWMA Changes Color
Added Alert On Bar Close option to avoid alerts from temporary intrabar color changes.
Removed experimental noise filters and kept smoothing as the only noise-control feature.
Improved calculation structure to reduce Pine Script consistency warnings.
Script open-source
Dans l'esprit TradingView, le créateur de ce script l'a rendu open source afin que les traders puissent examiner et vérifier ses fonctionnalités. Bravo à l'auteur! Bien que vous puissiez l'utiliser gratuitement, n'oubliez pas que la republication du code est soumise à nos Règles.

Clause de non-responsabilité
Les informations et publications ne sont pas destinées à être, et ne constituent pas, des conseils ou recommandations financiers, d'investissement, de trading ou autres fournis ou approuvés par TradingView. Pour en savoir plus, consultez les Conditions d'utilisation.
Script open-source
Dans l'esprit TradingView, le créateur de ce script l'a rendu open source afin que les traders puissent examiner et vérifier ses fonctionnalités. Bravo à l'auteur! Bien que vous puissiez l'utiliser gratuitement, n'oubliez pas que la republication du code est soumise à nos Règles.
Clause de non-responsabilité
Les informations et publications ne sont pas destinées à être, et ne constituent pas, des conseils ou recommandations financiers, d'investissement, de trading ou autres fournis ou approuvés par TradingView. Pour en savoir plus, consultez les Conditions d'utilisation.