Previous Day Range Fib Lite (PDR Fib Lite)
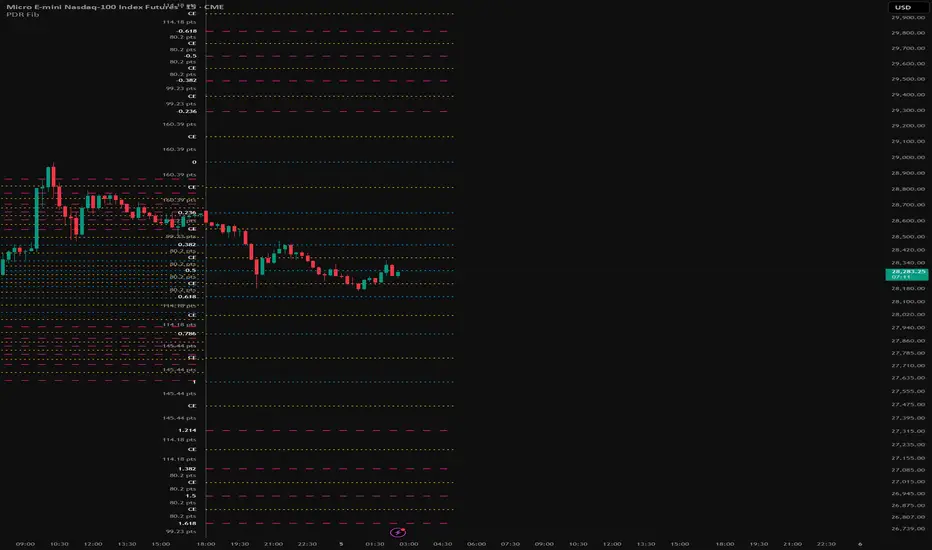
PDR Fib Lite draws Fibonacci levels on the previous session's high-low range (the Previous Day Range, PDR) and projects them forward through the next session. Each completed session gets its own fixed ladder, so you can read today's price against yesterday's range, or scroll back and see what each past day's levels looked like.
How it works
What it adds beyond the built-in Fib tool
How to use it
Key settings
Limitations
Notes
Fibonacci ratios are standard. CE (consequent encroachment, the midpoint of a range) and the range-multiple idea behind Standard Deviation mode are terms used in ICT-style analysis. This script only draws the levels and does not implement any trading method. Not financial advice.
How it works
- You choose a session anchor: a timezone plus an hour and minute (default 18:00 America/New_York, the daily rollover of CME index futures). A new session starts at each anchor time, not at midnight.
- While a session runs, the script tracks its high and low. When the next anchor arrives, that range is frozen.
- The frozen range is drawn as a ladder of levels, starting at the anchor bar and running to the next anchor. The most recent range keeps extending to the current bar.
- Orientation follows the session itself. If the session high formed after the low, 0% sits at the high and levels count down toward the low (100%). If the low formed after the high, 0% sits at the low and levels count up toward the high. So 0% is always the extreme reached last, and 100% is the opposite extreme where that move started.
What it adds beyond the built-in Fib tool
- Automatic placement every session, up to 20 sessions back, instead of drawing by hand each day.
- Anchor at any time and timezone, so the trading day matches the market you trade.
- Mirror levels that reflect the ladder beyond 0% and beyond 100% (for example 0.236 also plots -0.236 and 1.764), for projected levels outside the range.
- Optional CE lines: a midpoint between every pair of adjacent visible levels.
- Optional point labels: the distance in price points between each pair of adjacent lines, so nothing needs measuring. With CE on, the gaps become level-to-CE and CE-to-level.
- A second level set: Standard Deviation mode plots 0, 0.5 and 1 of the range. With both mirrors on it gives -1, -0.5, 0, 0.5, 1, 1.5 and 2. These are multiples of the range, not statistical standard deviation.
- Full style control (color, width, line style, label color) for core, mirrored and CE lines, plus optional fading of older days, and an optional thin vertical line at the start of each session (the anchor time).
How to use it
- Add it to an intraday chart and set the anchor and timezone for your market.
- Read price against the ladder: 0.5 is the midpoint of the previous session's range, and levels toward 100% are deeper retracements of that session's move.
- Turn on mirror levels, CE lines or point labels as needed. Use Fixed Length line mode if full-width lines clutter the chart.
Key settings
- Session Timezone, Anchor Hour, Anchor Minute: where each session starts and ends.
- Number of Days to Draw: 1 to 20, default 5.
- Level Mode: Fibonacci (0, 0.236, 0.382, 0.5, 0.618, 0.786, 1) or Standard Deviation (0, 0.5, 1).
- Mirror Beyond Extreme (0%), Mirror Beyond Origin (100%), Show 50%/CE Sub-lines Between Levels, Show Points Between Levels: all off by default.
- Line Length Mode: full session width, or a fixed number of bars.
- Fade Older Days, label size, and style inputs for each line group. Show Anchor Time Vertical Line (off by default) has its own color, width and style.
Limitations
- Built for intraday charts. On daily and higher timeframes every bar becomes its own session, so the output is not meaningful.
- The first session on the chart may be partial, because loaded history starts mid-session. How many past days appear also depends on how many bars your plan loads.
- TradingView caps a script at 500 lines and 500 labels. With the defaults the script uses 7 of each per day. With both mirrors, CE lines and point labels all on, it needs about 73 labels per day, so roughly 6 days fit. If lines or labels disappear, lower the day count or switch an option off.
- This is a levels tool. It generates no signals or alerts, and makes no claim about performance.
Notes
Fibonacci ratios are standard. CE (consequent encroachment, the midpoint of a range) and the range-multiple idea behind Standard Deviation mode are terms used in ICT-style analysis. This script only draws the levels and does not implement any trading method. Not financial advice.

Clause de non-responsabilité
Les informations et publications ne sont pas destinées à être, et ne constituent pas, des conseils ou recommandations financiers, d'investissement, de trading ou autres fournis ou approuvés par TradingView. Pour en savoir plus, consultez les Conditions d'utilisation.
Clause de non-responsabilité
Les informations et publications ne sont pas destinées à être, et ne constituent pas, des conseils ou recommandations financiers, d'investissement, de trading ou autres fournis ou approuvés par TradingView. Pour en savoir plus, consultez les Conditions d'utilisation.