Mis à jour
India VIX Based Nifty/BankNifty Range Calculator (Auto Fetch)
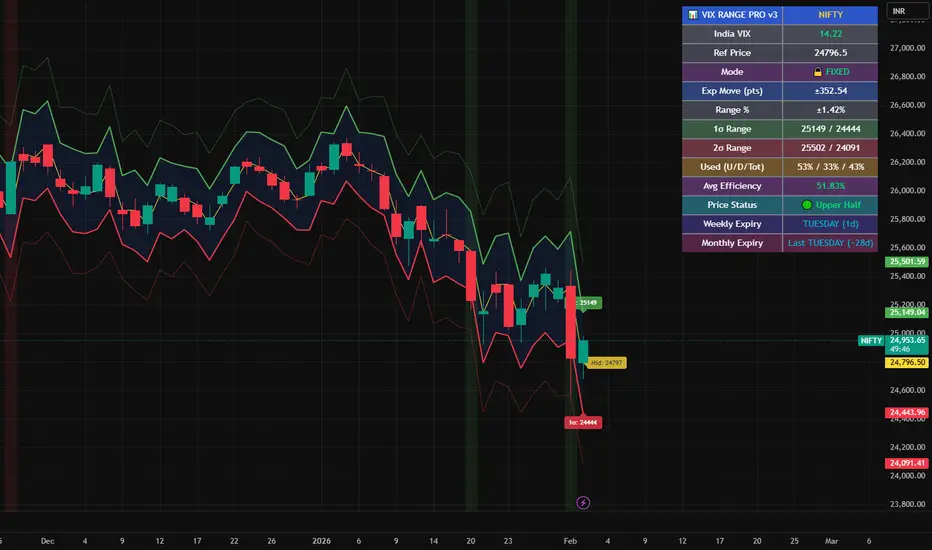
VIX-Based Expected Daily Range (Auto Volatility Forecast)
Created by: Harshiv Symposium
📖 Purpose
This indicator automatically fetches the India VIX value and calculates the expected daily price range for major Indian indices such as Nifty and BankNifty.
It helps traders understand how much the market is likely to move today based on current volatility conditions.
Designed for educational and analytical awareness, not for signals or profit-making systems.
⚙️ Core Logic
Expected Daily Move (Range) = (India VIX × Current Index Price) ÷ Multiplier
- Multiplier for Nifty: 1000
- Multiplier for BankNifty: 700
This calculation projects the 1-standard-deviation (≈ 68% probability) and 2-standard-deviation (≈ 95% probability) movement zones for the day.
📊 Example
If India VIX = 15 and Nifty = 25,000:
Expected Move ≈ (15 × 25,000) ÷ 1000 = 375 points
Hence,
- 68% Range: 24,625 – 25,375
- 95% Range: 24,250 – 25,750
This gives traders a realistic idea of daily volatility boundaries.
🧭 Key Features
✅ Auto-Fetch India VIX
No need for manual input — automatically pulls live data from NSE:INDIAVIX.
✅ Dynamic Range Visualization
Plots upper/lower boundaries for 1σ and 2σ probability zones with shaded expected-move area.
✅ Dashboard Panel
Displays:
- Current VIX
- Expected Move (in points and %)
- Upper and Lower Ranges
✅ Smart Alerts
Alerts when price crosses upper or lower volatility range — potential breakout signal.
🎯 How It Helps
Intraday Traders:
Know the likely daily movement (e.g., ±220 pts on Nifty) and plan realistic targets or stops.
Options Traders:
Quickly assess whether it’s a seller-friendly (low VIX, small range) or buyer-friendly (high VIX, large range) session.
Risk Managers:
Use volatility context for stop-loss width and position sizing.
Breakout Traders:
If price breaks beyond the 2σ range → indicates potential volatility expansion.
💡 Interpretation Guide
Condition Market Behavior Strategy Insight
VIX ↓ ( < 14 ) Calm / Range-bound Option Selling Edge
VIX ↑ ( > 20 ) Volatile Sessions Option Buying Edge
Price within Range Stable Market Mean Reversion Setups
Price breaks Range Volatility Expansion Breakout Trades
⚠️ Disclaimer
This indicator is for educational and awareness purposes only.
It does not generate buy/sell signals or guarantee returns.
Always apply your own analysis and risk management.
Created by: Harshiv Symposium
📖 Purpose
This indicator automatically fetches the India VIX value and calculates the expected daily price range for major Indian indices such as Nifty and BankNifty.
It helps traders understand how much the market is likely to move today based on current volatility conditions.
Designed for educational and analytical awareness, not for signals or profit-making systems.
⚙️ Core Logic
Expected Daily Move (Range) = (India VIX × Current Index Price) ÷ Multiplier
- Multiplier for Nifty: 1000
- Multiplier for BankNifty: 700
This calculation projects the 1-standard-deviation (≈ 68% probability) and 2-standard-deviation (≈ 95% probability) movement zones for the day.
📊 Example
If India VIX = 15 and Nifty = 25,000:
Expected Move ≈ (15 × 25,000) ÷ 1000 = 375 points
Hence,
- 68% Range: 24,625 – 25,375
- 95% Range: 24,250 – 25,750
This gives traders a realistic idea of daily volatility boundaries.
🧭 Key Features
✅ Auto-Fetch India VIX
No need for manual input — automatically pulls live data from NSE:INDIAVIX.
✅ Dynamic Range Visualization
Plots upper/lower boundaries for 1σ and 2σ probability zones with shaded expected-move area.
✅ Dashboard Panel
Displays:
- Current VIX
- Expected Move (in points and %)
- Upper and Lower Ranges
✅ Smart Alerts
Alerts when price crosses upper or lower volatility range — potential breakout signal.
🎯 How It Helps
Intraday Traders:
Know the likely daily movement (e.g., ±220 pts on Nifty) and plan realistic targets or stops.
Options Traders:
Quickly assess whether it’s a seller-friendly (low VIX, small range) or buyer-friendly (high VIX, large range) session.
Risk Managers:
Use volatility context for stop-loss width and position sizing.
Breakout Traders:
If price breaks beyond the 2σ range → indicates potential volatility expansion.
💡 Interpretation Guide
Condition Market Behavior Strategy Insight
VIX ↓ ( < 14 ) Calm / Range-bound Option Selling Edge
VIX ↑ ( > 20 ) Volatile Sessions Option Buying Edge
Price within Range Stable Market Mean Reversion Setups
Price breaks Range Volatility Expansion Breakout Trades
⚠️ Disclaimer
This indicator is for educational and awareness purposes only.
It does not generate buy/sell signals or guarantee returns.
Always apply your own analysis and risk management.
Notes de version
India VIX Based Nifty/BankNifty Range Calculator (Auto Adaptive, Intraday Optimized)This indicator mathematically estimates the expected intraday price movement of Nifty / BankNifty using the India VIX (Volatility Index) and dynamically plots 1σ (68% probability) and optional 2σ (95% probability) volatility-based price ranges.
The core concept is based on:
Expected Range = (India VIX × Price) ÷ Instrument Multiplier
India VIX is fetched directly from NSE in real time (daily).
Reference Price (Base) can be selected as:
🔹 Current Day Opening Price → stabilizes the range during intraday
🔸 Live Market Price (Close) → dynamically adjusts with market volatility
The indicator auto-detects whether the instrument is NIFTY or BANKNIFTY and applies optimized range calculation using:
📌 Multiplier 1000 for Nifty
📌 Multiplier 700 for BankNifty
📊 Plotted Levels
Level Type Meaning
Upper 1σ Range 68% probability upside
Lower 1σ Range 68% probability downside
Upper 2σ Range 95% probability upside (optional)
Lower 2σ Range 95% probability downside (optional)
Midline (Median Expected Price) (Only if enabled)
🔍 Information Panel Displays
India VIX
Reference price used
Expected move in points and percentage
1σ and 2σ range levels
% of range already covered intraday (Up/Down)
🎯 Use Cases
Intraday risk management
Defining max expected high/low zones
Reversal zone detection
Avoiding trades during extreme volatility
Algorithmic range-based trade setups
🛠 Originality
Unlike traditional ATR or fixed percent-based range indicators, this script:
Uses live India VIX, not static formulas
Automatically adapts to instrument type (Nifty/BankNifty)
Allows range stabilization using day open (rare feature)
Highlights when price moves beyond expected volatility threshold
💡 This indicator does not provide buy/sell signals, but defines statistically expected trading zones based on real-time volatility. Use it in conjunction with your existing price action or system strategies.
— Made for professional traders requiring calculated range expectations using volatility logic.
Notes de version
India VIX Range Calculator Pro v3 - Dual Mode Revised ExpiryProfessional VIX-based range calculator for Nifty/BankNifty with unique dual-mode system and NSE revised expiry detection.
WHAT'S UNIQUE:
1. Dual Mode System
- Fixed Mode: Locks levels at market open (no repainting, stable all day)
- Dynamic Mode: Live price updates (for swing traders)
2. NSE Revised Expiry (India-Specific)
- Auto-detects new schedule (post Aug 29, 2025)
- Nifty Weekly: Thursday → Tuesday
- Monthly: Last Tuesday with countdown timer
- Auto range adjustment on expiry days
3. Multi-Sigma Ranges
- 1σ (68%): Main trading zone
- 2σ (95%): Extreme moves
- 3σ (99.7%): Black swan detection
4. Historical Efficiency Tracker
- 10-day VIX accuracy comparison
- Shows if VIX over/underestimates
5. Price Status Indicator
- 6-level real-time position tracking
HOW IT WORKS:
Formula: Daily Range = (India VIX × Reference Price) / Multiplier
Multipliers: Nifty=1000, BankNifty=700 (customizable 100-2000)
Non-repainting: Fixed mode locks reference at day start
FOR INTRADAY TRADERS:
- Enable Fixed Mode
- Note 1σ levels at market open
- Trade within boundaries
- Exit near 2σ
FOR OPTIONS SELLERS:
- Sell strikes at 1σ levels
- Stop-loss at 2σ
- Enable expiry adjustment
- Monitor range usage %
DASHBOARD METRICS:
- VIX (color-coded: <15 green, 15-20 orange, >20 red)
- Mode: 🔒 FIXED or 🔄 DYNAMIC
- Expected Move & Range %
- 1σ/2σ levels
- Range Used (Upside/Downside/Total %)
- Efficiency % (VIX accuracy)
- Price Status (current position)
- Weekly/Monthly Expiry countdown
ALERTS:
- 1σ touch/close
- 2σ extreme moves
- 3σ black swan events
- Midline crosses
- Expiry day reminders
LIMITATIONS:
- VIX is prediction, not guarantee
- Markets can exceed any range
- Not a standalone system
- Always use stop losses
- Works best on standard candles (not Heikin Ashi/Renko)
RISK WARNING:
Trading derivatives involves substantial risk. Past performance doesn't guarantee future results. VIX ranges are statistical estimates. Use proper position sizing, maintain stops, never risk more than you can afford to lose.
Pine v6 | Open Source | Mozilla License 2.0
v3.0 Major Update:
- Added dual mode system (Fixed/Dynamic)
- NSE revised expiry detection with countdown
- 3σ black swan range
- Historical efficiency tracking (10-day)
- 6-level price status indicator
- Enhanced dashboard with mode display
- Non-repainting architecture
- 10+ smart alert conditions
- Customizable multipliers (100-2000)
- Multi-timeframe VIX (D/W/M)
- Expiry day range adjustment

Clause de non-responsabilité
Les informations et publications ne sont pas destinées à être, et ne constituent pas, des conseils ou recommandations financiers, d'investissement, de trading ou autres fournis ou approuvés par TradingView. Pour en savoir plus, consultez les Conditions d'utilisation.
Clause de non-responsabilité
Les informations et publications ne sont pas destinées à être, et ne constituent pas, des conseils ou recommandations financiers, d'investissement, de trading ou autres fournis ou approuvés par TradingView. Pour en savoir plus, consultez les Conditions d'utilisation.