Aurora Flow | Regime-Filtered Volatility Trend Strategy
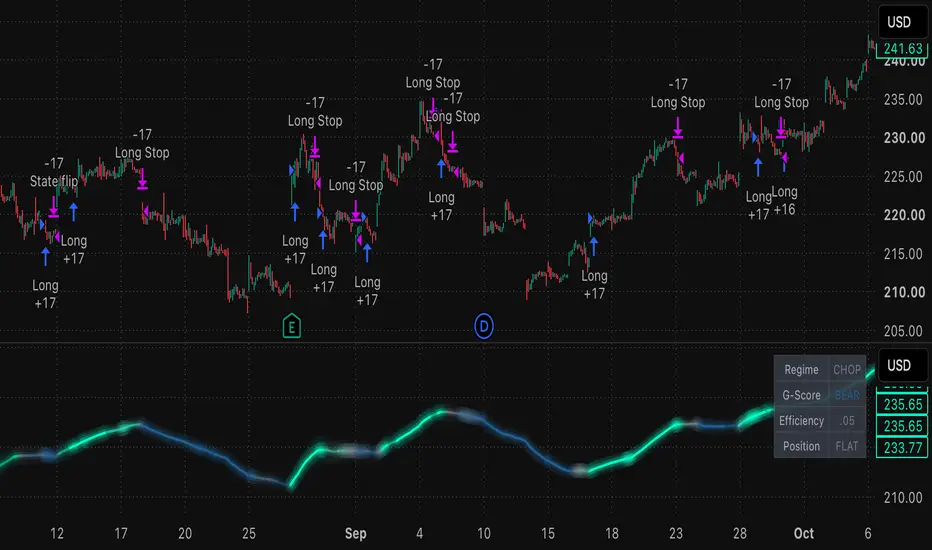
Aurora Flow is a trend-following strategy that aims to take trades only when a trend is strong and the market is orderly. It combines a statistical momentum signal with a market-condition filter.
1. The signal (G-Score). Price is converted to a Z-score, which measures how far price has moved from its recent average in standard deviations, then smoothed. That reading is compared to a dynamic envelope based on the Z-score of recent volatility. The envelope is never narrower than a minimum floor. If the smoothed price Z-score breaks above the envelope, the state turns bullish. If it breaks below, the state turns bearish. Between the two, the previous state holds. Because the envelope reacts to volatility, the signal asks for more evidence of a move when conditions are volatile.
2. The trend filter. Longs are allowed only when price is above the trend EMA (50 by default), and shorts only when price is below it.
3. The regime filter. Before any entry, the script checks two things:
Path efficiency: how directly price has travelled over the lookback. Low efficiency means choppy, back-and-forth action, and entries are skipped.
Volatility spike check: if current ATR is far above its baseline, entries are skipped.
4. Entries and exits.
Tips
Warnings
1. The signal (G-Score). Price is converted to a Z-score, which measures how far price has moved from its recent average in standard deviations, then smoothed. That reading is compared to a dynamic envelope based on the Z-score of recent volatility. The envelope is never narrower than a minimum floor. If the smoothed price Z-score breaks above the envelope, the state turns bullish. If it breaks below, the state turns bearish. Between the two, the previous state holds. Because the envelope reacts to volatility, the signal asks for more evidence of a move when conditions are volatile.
2. The trend filter. Longs are allowed only when price is above the trend EMA (50 by default), and shorts only when price is below it.
3. The regime filter. Before any entry, the script checks two things:
Path efficiency: how directly price has travelled over the lookback. Low efficiency means choppy, back-and-forth action, and entries are skipped.
Volatility spike check: if current ATR is far above its baseline, entries are skipped.
4. Entries and exits.
- Entry: on the first bar where the setup appears (bullish state, price above the EMA, market tradable).
- Trailing stop: an ATR-based trailing stop that only moves in the trade’s favor.
- State flip: the trade also closes if the G-Score flips against the position.
- Features
- Glow line: a single glowing trend line on the price chart. Its color blends from bearish to neutral to bullish with the strength of the G-Score.
- Fade bands: ATR bands that fade out from the line.
- Candle coloring: candles use the same color flow.
- Dimming: the line dims automatically when the market is choppy or volatile, which are the conditions where entries are skipped.
- Color modes: three palettes (Standard, Nordic, Simple).
- Dashboard: shows the current regime, G-Score state, efficiency and position.
- Longs and shorts: long-only by default. Shorts can be switched on.
- Defaults: 20% of equity per trade, 0.05% commission and 2 ticks of slippage.
- Settings: the trailing stop, threshold floor, efficiency filter and spike filter are all adjustable.
Tips
- Start on higher timeframes. 15-minute charts and above tend to suit it better, because lower timeframes are noisier.
- If you see too many whipsaws, raise Min threshold (try 0.7 to 1.0) and Min path efficiency (try 0.25 to 0.30). You’ll get fewer, higher-quality trades.
- If trades get stopped out too early, widen the trailing stop (try 3.0 ATR).
- Test shorts separately. Many stocks drift upward, so long-only is a sensible baseline. Shorts need their own testing.
- Match the settings to the market. Stocks, crypto, forex and futures behave differently, so test the defaults on each before relying on them.
- Check several symbols and periods. A strategy that works on one symbol or one stretch of history may not work elsewhere.
- Use the dimming as a guide. When the line is faded, the filter considers the market untradable.
Warnings
- No guarantee of profit. Backtest results are hypothetical and don’t predict future performance.
- Settings are not optimized for your market. The defaults are starting points. Tuning them heavily to fit past data can produce curve-fit results that fail in live trading.
- Trend strategies lose in sideways or reversing markets. The regime filter reduces this but cannot eliminate it, and the strategy will have losing streaks.
- Real-world fills differ from backtests. Slippage, gaps, fees, spreads and liquidity can all hurt results. Gaps in stocks can jump past a stop.
- Stops are checked on bar close. The trailing stop is calculated from closes and orders fill on later bars, so actual exits can be worse than the stop level.
- Position sizing matters. The default of 20% of equity per trade may be too aggressive for your risk tolerance.
- Check the trade count. A small number of trades gives unreliable statistics.
- For educational purposes only. This is not financial advice. Do your own research and manage your own risk.

Clause de non-responsabilité
Les informations et publications ne sont pas destinées à être, et ne constituent pas, des conseils ou recommandations financiers, d'investissement, de trading ou autres fournis ou approuvés par TradingView. Pour en savoir plus, consultez les Conditions d'utilisation.
Clause de non-responsabilité
Les informations et publications ne sont pas destinées à être, et ne constituent pas, des conseils ou recommandations financiers, d'investissement, de trading ou autres fournis ou approuvés par TradingView. Pour en savoir plus, consultez les Conditions d'utilisation.