Mis à jour
Bubble scanner Board
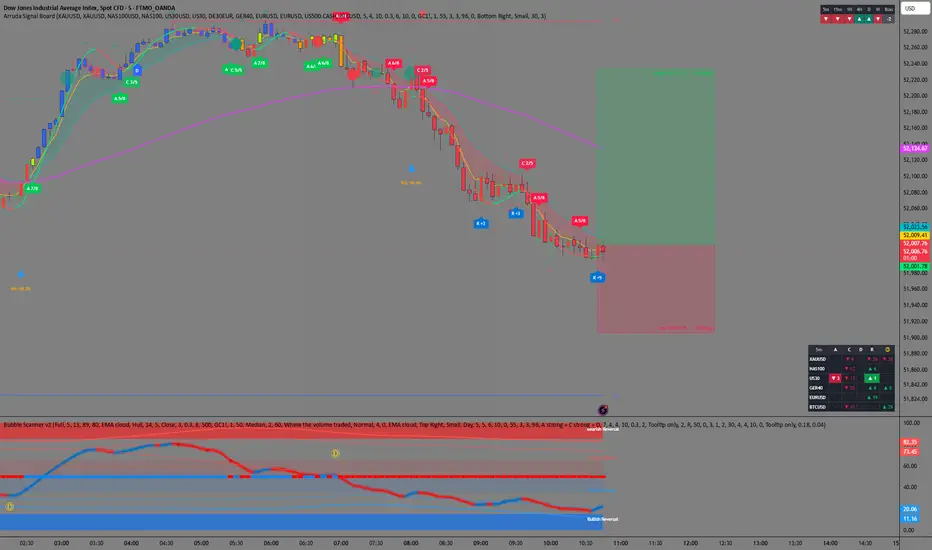
Arruda Signal Board – A · C · D · R · Ⓓ on 6 markets
The Signal Board is a companion to the Bubble Scanner. It shows, in one table, the last signal of each type on up to 6 markets. You can follow gold, indices, forex and crypto from a single chart.
WHAT IT SHOWS
There is one row per market and one column per signal type:
A≈ (pullback with the trend, approximate): the EMA 5/13 cloud flips with the trend.
C≈ (continuation, approximate): a pullback inside the trend that resumes when the Hull average turns.
D (Donchian breakout): the close breaks the 55-candle high or low, with the closed 1H and 4H trend aligned and price beyond EMA 89.
R (reversal at the band): price touches the band and closes back with a real-bodied candle while the oscillator turns. A confluence score (+N) comes with it.
Ⓓ (oscillator divergence): price makes a new high or low and the oscillator does not confirm it.
HOW TO READ IT
▲ / ▼: last signal is a buy / sell. The number is how many candles of that market have passed since the signal.
“now”: the signal printed on the candle that just closed.
Coloured background: a signal from the last 3 candles. You can change this number.
“–”: no signal in the last 30 candles. You can change this limit too.
Tooltip: hover a cell to see the time, the closing price and the score of the signal.
Signals are calculated on the timeframe of the chart the board sits on. On a 5m chart you see the 5m signals of every market.
DEFAULT MARKETS
XAUUSD, NAS100, US30, GER40, EURUSD and BTCUSD. Each market can be changed, renamed or switched off in the settings.
ACCURACY
D, R and Ⓓ: they use the same calculations as the Bubble Scanner, which only need price.
A and C: they are approximations, marked “≈” in the table. The volume bubbles, delta/CVD and EQH/EQL zones need lower-timeframe volume, which is too heavy to request for 6 markets at once. Without those parts, A is scored out of 6 and C out of 3. A signal on the board may therefore differ from the one on that market’s own chart.
ALERTS
“Any alert() function call”: one message per new signal, with the market, the signal type, the direction and the price. You choose which signal types send alerts.
“New signal on any market”: a simple alert that fires on any new signal.
NOTES
The board refreshes when a candle closes on its chart.
The first load can take a few seconds. If TradingView reports a timeout, switch off one or two markets.
Markets that are closed keep showing their last signal.
Always use your own risk management.
For educational purposes only. Not financial advice.
The Signal Board is a companion to the Bubble Scanner. It shows, in one table, the last signal of each type on up to 6 markets. You can follow gold, indices, forex and crypto from a single chart.
WHAT IT SHOWS
There is one row per market and one column per signal type:
A≈ (pullback with the trend, approximate): the EMA 5/13 cloud flips with the trend.
C≈ (continuation, approximate): a pullback inside the trend that resumes when the Hull average turns.
D (Donchian breakout): the close breaks the 55-candle high or low, with the closed 1H and 4H trend aligned and price beyond EMA 89.
R (reversal at the band): price touches the band and closes back with a real-bodied candle while the oscillator turns. A confluence score (+N) comes with it.
Ⓓ (oscillator divergence): price makes a new high or low and the oscillator does not confirm it.
HOW TO READ IT
▲ / ▼: last signal is a buy / sell. The number is how many candles of that market have passed since the signal.
“now”: the signal printed on the candle that just closed.
Coloured background: a signal from the last 3 candles. You can change this number.
“–”: no signal in the last 30 candles. You can change this limit too.
Tooltip: hover a cell to see the time, the closing price and the score of the signal.
Signals are calculated on the timeframe of the chart the board sits on. On a 5m chart you see the 5m signals of every market.
DEFAULT MARKETS
XAUUSD, NAS100, US30, GER40, EURUSD and BTCUSD. Each market can be changed, renamed or switched off in the settings.
ACCURACY
D, R and Ⓓ: they use the same calculations as the Bubble Scanner, which only need price.
A and C: they are approximations, marked “≈” in the table. The volume bubbles, delta/CVD and EQH/EQL zones need lower-timeframe volume, which is too heavy to request for 6 markets at once. Without those parts, A is scored out of 6 and C out of 3. A signal on the board may therefore differ from the one on that market’s own chart.
ALERTS
“Any alert() function call”: one message per new signal, with the market, the signal type, the direction and the price. You choose which signal types send alerts.
“New signal on any market”: a simple alert that fires on any new signal.
NOTES
The board refreshes when a candle closes on its chart.
The first load can take a few seconds. If TradingView reports a timeout, switch off one or two markets.
Markets that are closed keep showing their last signal.
Always use your own risk management.
For educational purposes only. Not financial advice.
Notes de version
Arruda Signal Board – A · C · D · R · Ⓓ on 6 marketsThe Signal Board is a companion to the Bubble Scanner. It shows, in one table, the last signal of each type on up to 6 markets. You can follow gold, indices, forex and crypto from a single chart.
WHAT IT SHOWS
There is one row per market and one column per signal type:
A (pullback with the trend): the EMA 5/13 cloud flips with the trend, with a score of 8 points:
– bias across 6 timeframes;
– EMA 89;
– market structure;
– pullback to EQH/EQL, the BOS level or EMA 89;
– volume bubble;
– counter-trend candle;
– delta/CVD;
– Hull direction.
A can reappear while the cloud keeps its colour, if the score comes back.
C (continuation): a pullback inside the trend that resumes when the Hull turns or a volume bubble prints (score of 5).
D (Donchian breakout): the close breaks the 55-candle high or low, with the closed 1H and 4H trend aligned and price beyond EMA 89.
R (reversal at the band): price touches the band and closes back with a real-bodied candle while the oscillator turns. A confluence score (+N) comes with it.
Ⓓ (oscillator divergence): price makes a new high or low and the oscillator does not confirm it.
All signals use the same calculations and default settings as the Bubble Scanner. They are confirmed on candle close.
HOW TO READ IT
▲ / ▼: last signal is a buy / sell. The number is how many candles of that market have passed since the signal.
“now”: the signal printed on the candle that just closed.
Coloured background: a signal from the last 3 candles (adjustable).
“–”: no signal in the last 30 candles (adjustable).
Tooltip: hover a cell to see the time, the closing price and the score of the signal.
Signals are calculated on the timeframe of the chart the board sits on. On a 5m chart you see the 5m signals of every market.
DEFAULT MARKETS
XAUUSD, NAS100, US30, GER40, EURUSD and BTCUSD. Each market can be changed, renamed or switched off.
VOLUME
Buy and sell volume is taken from 1-minute candles. For gold the default source is COMEX gold futures (GC1!), the same as in the Bubble Scanner. The other markets use their own volume.
ALERTS
“Any alert() function call”: one message per new signal, with the market, the signal type, the direction and the price. You choose which signal types send alerts.
“New signal on any market”: a simple alert that fires on any new signal.
NOTES
The board uses 36 data requests for 6 markets. TradingView allows 40 on most plans.
The first load can take a few seconds. If TradingView reports a timeout, switch off one or two markets.
The board refreshes when a candle closes on its chart. Markets that are closed keep showing their last signal.
Futures volume can be delayed by about 10 minutes without a CME data subscription. On the newest candles, gold may then miss the bubble and delta points, exactly as on its own chart.
Always use your own risk management.
For educational purposes only. Not financial advice.

Clause de non-responsabilité
Les informations et publications ne sont pas destinées à être, et ne constituent pas, des conseils ou recommandations financiers, d'investissement, de trading ou autres fournis ou approuvés par TradingView. Pour en savoir plus, consultez les Conditions d'utilisation.
Clause de non-responsabilité
Les informations et publications ne sont pas destinées à être, et ne constituent pas, des conseils ou recommandations financiers, d'investissement, de trading ou autres fournis ou approuvés par TradingView. Pour en savoir plus, consultez les Conditions d'utilisation.