Mis à jour
QQQ/SPY Live Convergence
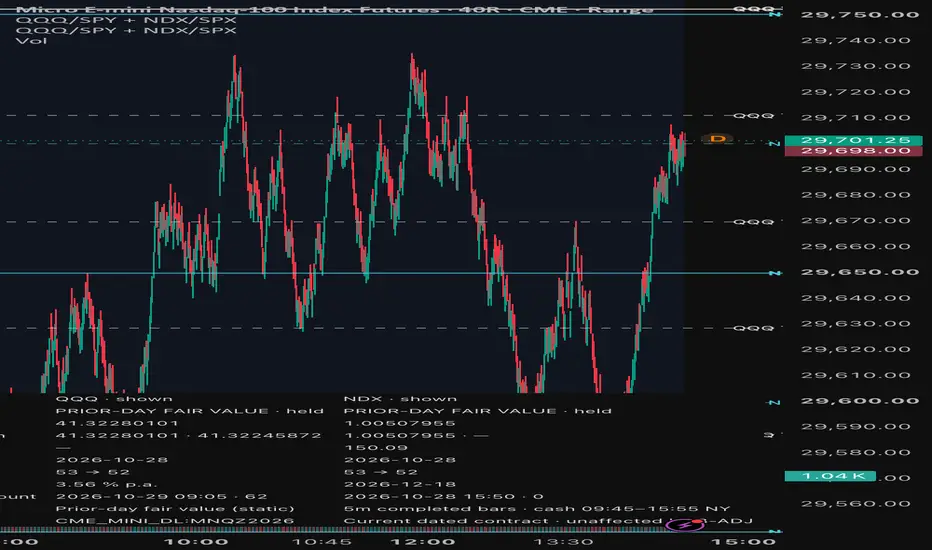
QQQ/SPY live convergence
Projects QQQ price levels onto NQ/MNQ and SPY levels onto ES/MES. Only the relevant set is shown: QQQ on Nasdaq futures, SPY on S&P futures.
• Futures/ETF ratio calibrated on synchronized 1-minute data, so levels line up the same on any chart timeframe
• Smoothed ratio with outlier filtering; re-anchors automatically after ex-dividend gaps or contract rolls
• Uses the front contract the chart is showing, so rolls are handled automatically
• Ratio held overnight and on weekends, adjusted for interest-rate carry
• Every $5 level (e.g. 750 / 755 / 760) drawn solid and bold, the rest dashed
• Optional info table with the live ratio, sync status and calibration error
F3L1X the DEV NQ1!
 ES1!
 QQQ
 SPY
Projects QQQ price levels onto NQ/MNQ and SPY levels onto ES/MES. Only the relevant set is shown: QQQ on Nasdaq futures, SPY on S&P futures.
• Futures/ETF ratio calibrated on synchronized 1-minute data, so levels line up the same on any chart timeframe
• Smoothed ratio with outlier filtering; re-anchors automatically after ex-dividend gaps or contract rolls
• Uses the front contract the chart is showing, so rolls are handled automatically
• Ratio held overnight and on weekends, adjusted for interest-rate carry
• Every $5 level (e.g. 750 / 755 / 760) drawn solid and bold, the rest dashed
• Optional info table with the live ratio, sync status and calibration error
F3L1X the DEV
NQ1! ES1! QQQ SPY Notes de version
Updated the public script to version 2.Notes de version
QQQ/SPY + NDX/SPX Convergence For NQ/ES +CFDThis update adds two reference grids for each market family: QQQ and NDX for Nasdaq, and SPY and SPX for the S&P 500. It translates round ETF and cash-index price levels into the price scale of your supported chart, so you can read both sets of levels without switching charts.
For example, on NQ you can display QQQ dollar levels and NDX index levels together. On ES, the equivalent grids are SPY and SPX. Labels identify the original instrument and its original price level; the horizontal line marks the converted price on your chart.
Supported charts
• Nasdaq futures: NQ and MNQ on supported CME feeds, including NQ1! and MNQ1!.
• S&P futures: ES and MES on supported CME feeds, including ES1! and MES1!.
• ETFs: NASDAQ:QQQ and AMEX:SPY, plus the supported BATS variants.
• Cash indices: NASDAQ:NDX and SP:SPX.
• Additional price bases: OANDA:NAS100USD and TVC:SPX.
Use standard time-based candles from 1 to 60 minutes. Other broker CFD tickers are not automatically supported just because they track the same index. Daily charts and synthetic chart types such as Heikin Ashi, Renko and Range are outside this version's supported context.
How the conversion works
This version uses a fixed daily anchor rather than a ratio that continuously follows the live market. It takes completed 15-minute bars ending at exactly 16:00 America/New_York, matches the destination price, ETF price and cash-index price by timestamp, and locks the complete bundle at the first available bar of the next session starting at 18:00 New York time. Time-zone handling follows New York daylight saving time.
Let C0 be the destination basis price, E0 the ETF price and I0 the cash-index price at the matched anchor:
R = C0 / E0
B = C0 − I0
On a futures chart or a supported direct CFD basis:
ETF level → ETF level × R
Index level → Index level + B
Example: if the anchor ratio is 40, QQQ 500 maps to 20,000 on that basis. If the index spread is +100 points, NDX 19,900 maps to 20,000. These numbers illustrate the formulas; they are not today's market values.
On an ETF chart, its own levels stay on their native scale and index levels use (index level + B) / R. On a cash-index chart, its own levels stay native and ETF levels use ETF level × R − B. Both conversions share the same matched anchor.
OANDA:NAS100USD and TVC:SPX calibrate directly to their own price feed. Their automatic conversion does not depend on an NQ or ES futures rollover.
Session and contract handling
Continuous futures calibration resolves the current underlying delivery using TradingView metadata and uses that delivery's unadjusted price history. Keep futures back-adjustment (B-ADJ) OFF. With a dated futures chart, the calibration contract must match the same delivery suffix; choose the matching NQ or ES delivery in Advanced — Calibration. MNQ uses NQ price units, and MES uses ES price units. A 2! chart requires the matching 2! calibration setting.
If an exact new anchor is missing, the script retains the entire previous matched bundle and marks it as retained. It does not mix prices from different days or silently treat a missing anchor as a fresh calibration. Missing contract metadata, mismatched delivery or an unsupported chart context can block automatic converted grids. Native ETF/index identity levels can remain available independently.
Settings
Choose each source grid, the number of levels around the current price, level spacing and major-level intervals. Adjust line visibility, label size, label mode and right-side label spacing. The labels use transparent backgrounds, remain on the level and move with the latest bar; displaced labels have a connector to the exact price. Leave sufficient right margin to see both columns.
The optional mapped-price display shows the destination price alongside the original source level. Diagnostics show anchor prices, timestamps, conversion factors and status.
Automatic calibration is the normal setting. Manual factors are fixed values that you must maintain yourself. For an ETF/index cross-conversion, enable both manual factors for the same basis; mixed manual and automatic cross-conversion is blocked. Supported CFD/direct-basis charts require automatic calibration.
What these levels represent
These are mapped price references using a static anchor. The grids recenter around the current chart price and show the current calibration; they are not an archive of past levels. A fixed anchor does not measure the intraday futures/cash basis continuously and does not guarantee that two markets will converge at a particular time.
The indicator does not measure options positioning, gamma exposure, order flow or actual resting orders. The drawn levels are not proof of support/resistance, a trading signal or a demonstrated trading edge. Results depend on the available source feeds and their timestamps, including delays, gaps and revisions.
Changes in this release
• Dual ETF/index grids: QQQ + NDX and SPY + SPX.
• Fixed daily matched calibration replaces the previous live-conversion behavior.
• Atomic anchor updates and explicit retained/missing-data status.
• Current-delivery resolution for continuous futures and direct-basis support for OANDA:NAS100USD and TVC:SPX.
• Transparent labels to the right of the latest bars and adaptive column separation.
Credits: inspired by “QQQ NDX NQ Price Converter [Pt]” and “SPY SPX ES Price Converter [Pt]” by PtGambler. The source retains the Mozilla Public License 2.0 notice and attribution.
Notes de version
Calculation update: revised synchronized completed-bar sampling, basis estimation, and futures carry adjustments for QQQ, NDX, SPY, and SPX price levels.Notes de version
Added support for Range charts and 1–60 minute Heikin Ashi charts. Calibration now runs on standard market-price time bars; Range charts use a five-minute engine with independent history to retain the prior cash-session anchor. Heikin Ashi synthetic OHLC is excluded from calibration and grid centering. Existing fair-value formulas, carry adjustments, inputs and drawing limits are preserved. Verified on MNQ1! and ES1! in Range and Heikin Ashi; MNQ mapping coefficients match ordinary 5-minute candles.
Clause de non-responsabilité
Les informations et publications ne sont pas destinées à être, et ne constituent pas, des conseils ou recommandations financiers, d'investissement, de trading ou autres fournis ou approuvés par TradingView. Pour en savoir plus, consultez les Conditions d'utilisation.
Clause de non-responsabilité
Les informations et publications ne sont pas destinées à être, et ne constituent pas, des conseils ou recommandations financiers, d'investissement, de trading ou autres fournis ou approuvés par TradingView. Pour en savoir plus, consultez les Conditions d'utilisation.