OPEN-SOURCE SCRIPT
Crypto Non-Causality Suite [Alpha Council]
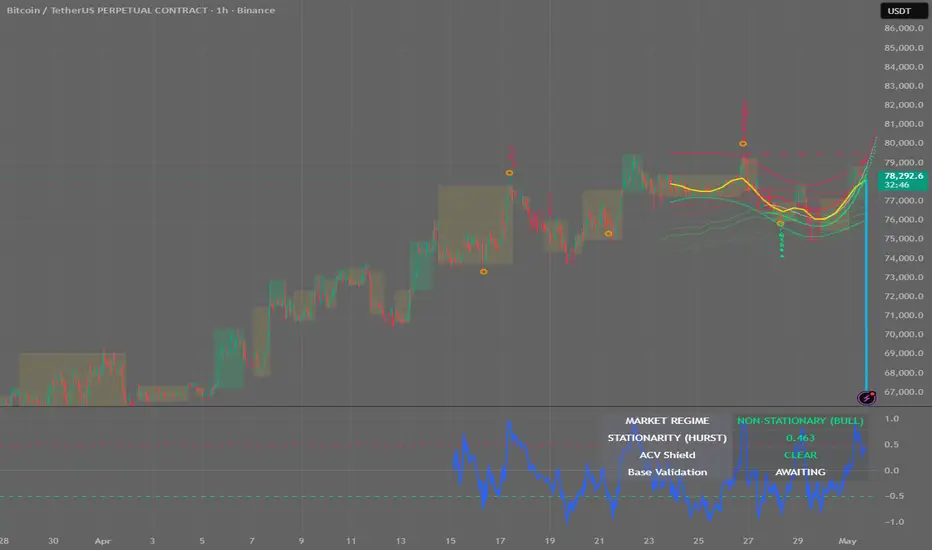
Crypto Non-Causality Suite v4 [Alpha Council]
The Crypto Non-Causality Suite (NCS) is an advanced, institutional-grade proof-of-concept designed to map the structural physics of the cryptocurrency market.
Traditional indicators are strictly causal—they look backward to calculate a lagging average of the past. The NCS operates differently. It utilizes heavy multidimensional arrays, matrix inversions, and fractional calculus to observe the entire time-series simultaneously. By calculating a "future-smoothed" structural state, it maps inevitable market attractors rather than lagging averages.
To bridge the gap between non-causal prediction and safe live execution, this suite employs a strict Dual-Phase Architecture: an adaptable, repainting "Spatial Map" to find the extremes, and a 100% causal, zero-lag "Execution Layer" to pull the trigger.
🧩 THE UNIFIED MODULES
1. The Spatial Map (Non-Causal Topology)
2. The Stationarity Gate (Hurst-Fractal Regime)
Standard indicators fail because they do not know if the market is trending or ranging.
3. The ACV Defense Vault (Pulse Engine)
Adverse Cascade Vulnerability (ACV) gets retail killed. When a market enters a violent liquidation cascade, mean-reverting indicators assume the market is "oversold" and bait traders into buying a falling knife.
4. The Causal Firing Pin (Execution Layer)
You cannot execute a live trade blindly on a fluid, repainting boundary. Once the non-causal math "arms" the system, we drop to the micro-structure.
Note: These triggers use strict anti-lookahead parameters and print permanently locked text labels (e.g., [CVD ▼]) directly onto the wicks.
5. Contextual Magnetism & Future Projections
⚙️ TACTICAL WORKFLOW (HOW TO TRADE THIS)
The Trap (Setup): Wait for price to violently pierce the Whittaker or PRC non-causal boundaries.
The Friction (Validation): Ensure the ACV Shield is clear (check the HUD). Wait for an Absorption Star (❂) to print on the wick, proving an institutional limit wall has absorbed the forced liquidations.
The Capture (Execution): Wait for a micro-causal tag (CVD, OI, PREM, or USDT) to stack vertically above/below the wick. Execute the trade.
The Target (Exit): Hold the position until price structurally tags the nearest Unmitigated Liquidity Polyline left by a previous anomaly.
⚠️ ARCHITECTURAL LIMITS & DISCLAIMERS
The Crypto Non-Causality Suite (NCS) is an advanced, institutional-grade proof-of-concept designed to map the structural physics of the cryptocurrency market.
Traditional indicators are strictly causal—they look backward to calculate a lagging average of the past. The NCS operates differently. It utilizes heavy multidimensional arrays, matrix inversions, and fractional calculus to observe the entire time-series simultaneously. By calculating a "future-smoothed" structural state, it maps inevitable market attractors rather than lagging averages.
To bridge the gap between non-causal prediction and safe live execution, this suite employs a strict Dual-Phase Architecture: an adaptable, repainting "Spatial Map" to find the extremes, and a 100% causal, zero-lag "Execution Layer" to pull the trigger.
🧩 THE UNIFIED MODULES
1. The Spatial Map (Non-Causal Topology)
[] Whittaker Kinematic Boundaries: We use independent pentadiagonal matrix solves to extract the absolute upper and lower boundaries of the market's kinematic energy.
[] Nadaraya-Watson Core (The Attractor): A heavy Gaussian kernel estimator tears through the center of the Whittaker Envelope, acting as the probabilistic center of mass for price action.- Polynomial Regression Channel (PRC): An integrated fast-twitch matrix overlay mapped via Ordinary Least Squares (OLS) normal equations. It aggressively maps itself to the immediate momentum of the data to act as a dynamic "net" that snaps to the wicks long before the heavier Whittaker envelope catches up.
2. The Stationarity Gate (Hurst-Fractal Regime)
Standard indicators fail because they do not know if the market is trending or ranging.
[] Hurst Exponent Proxy: The engine computes the Hurst Exponent via a modified Choppiness Index. If Hurst < 0.5, the market is Mean-Reverting (Stationary). If Hurst > 0.5, the market is Trending (Non-Stationary).
[] Regime Ribbon & Fill: A Viterbi-approximated HMM logic uses this stationarity data, along with RSI, ADX, and CVD, to paint contiguous, non-causal regime boxes directly onto your chart. The system mathematically blocks counter-trend mean-reversion boundaries during non-stationary trending environments.
3. The ACV Defense Vault (Pulse Engine)
Adverse Cascade Vulnerability (ACV) gets retail killed. When a market enters a violent liquidation cascade, mean-reverting indicators assume the market is "oversold" and bait traders into buying a falling knife.
[] Kinematic Saturation Decay: The suite tracks sustained directional inertia. If the market is in free-fall and the "Pulse" crosses 80% saturation, the system physically locks you out of trading until the kinetic energy bleeds out.
[] LWA & LSP Gates: The shield only drops when it detects a Liquidation Wick Anomaly (a massive ATR expansion met with a >45% rejection wick on climax volume) or a Liquidity Sweep Protocol (price pierces a 7-bar pivot and immediately rejects).
4. The Causal Firing Pin (Execution Layer)
You cannot execute a live trade blindly on a fluid, repainting boundary. Once the non-causal math "arms" the system, we drop to the micro-structure.
[] CVD Absorption (CVD): If the higher-timeframe signals a top, but the lower-timeframe Cumulative Volume Delta makes a lower-high as price makes a higher-high, limit sellers are absorbing the retail market buys.
[] Open Interest Exhaustion (OI): If price pushes into the boundary but OI suddenly drops, the move is a fakeout fueled by short liquidations, not new capital.
[] Premium Index Snap (PREM): Tracks the unwinding of derivative funding greed/fear.
[] Macro Capital Fracture (USDT): Cross-verifies with Tether dominance to ensure macro-capital flight has stalled.
Note: These triggers use strict anti-lookahead parameters and print permanently locked text labels (e.g., [CVD ▼]) directly onto the wicks.
5. Contextual Magnetism & Future Projections
[] Algorithmic Killzones: The engine maps a 24x Anomaly Anchor Meta-Mean (based on 2.5σ volume spikes) and projects 25x, 50x, and 100x simulated liquidation heatmaps directly onto the chart.
[] Unmitigated Liquidity Polylines: When an Absorption Star (❂) prints, the engine drops a dashed polyline from the extreme wick and projects it endlessly into the future to act as a non-repainting Take Profit (TP) magnet.- Inverse Kernel Bounding (IKB): Replaces repainting Dynamic Time Warping. It generates an expanding GARCH-style multiverse cone, projecting future paths and culling them if they exceed the historical velocity limits of the Nadaraya-Watson core.
⚙️ TACTICAL WORKFLOW (HOW TO TRADE THIS)
The Trap (Setup): Wait for price to violently pierce the Whittaker or PRC non-causal boundaries.
The Friction (Validation): Ensure the ACV Shield is clear (check the HUD). Wait for an Absorption Star (❂) to print on the wick, proving an institutional limit wall has absorbed the forced liquidations.
The Capture (Execution): Wait for a micro-causal tag (CVD, OI, PREM, or USDT) to stack vertically above/below the wick. Execute the trade.
The Target (Exit): Hold the position until price structurally tags the nearest Unmitigated Liquidity Polyline left by a previous anomaly.
⚠️ ARCHITECTURAL LIMITS & DISCLAIMERS
[] Repainting Notice: The Whittaker envelopes, PRC, NW core, and Regime Fills use barstate.islast to observe the whole dataset and WILL REPAINT historically to find the optimal polynomial fit. However, Absorption Stars (❂) are permanently locked to causal conditions and will NOT repaint (Execution labels will). Trade the Stars, use the envelopes only as a map and labels as interest.
[] Computational Load: This suite forces heavy matrix algebra. The script manages its line/box budget dynamically via decimation loops. Keep the "Topological Window" reasonable (e.g., 400 bars) to avoid compiler timeouts.
Script open-source
Dans l'esprit TradingView, le créateur de ce script l'a rendu open source afin que les traders puissent examiner et vérifier ses fonctionnalités. Bravo à l'auteur! Bien que vous puissiez l'utiliser gratuitement, n'oubliez pas que la republication du code est soumise à nos Règles.

Clause de non-responsabilité
Les informations et publications ne sont pas destinées à être, et ne constituent pas, des conseils ou recommandations financiers, d'investissement, de trading ou autres fournis ou approuvés par TradingView. Pour en savoir plus, consultez les Conditions d'utilisation.
Script open-source
Dans l'esprit TradingView, le créateur de ce script l'a rendu open source afin que les traders puissent examiner et vérifier ses fonctionnalités. Bravo à l'auteur! Bien que vous puissiez l'utiliser gratuitement, n'oubliez pas que la republication du code est soumise à nos Règles.
Clause de non-responsabilité
Les informations et publications ne sont pas destinées à être, et ne constituent pas, des conseils ou recommandations financiers, d'investissement, de trading ou autres fournis ou approuvés par TradingView. Pour en savoir plus, consultez les Conditions d'utilisation.