OPEN-SOURCE SCRIPT
Mis à jour Weekly Range Break Planner [AGPro Series]
# Weekly Range Break Planner [AGPro Series]
🧠 Core Idea
Is the weekly range break strong enough to monitor, or is price likely to fail back inside the range?
📌 Overview / What it does
Weekly Range Break Planner is a weekly range decision-support script built to evaluate whether price is breaking beyond the previous week's high or low with enough structural quality.
The script maps the previous weekly high, low, and midpoint, detects bullish or bearish breaks, builds a retest shelf around the broken boundary, scores the break from 0 to 100, and summarizes the current state inside a compact AG Pro panel.
It does not predict price direction, automate trades, or provide guaranteed signals. It is designed to organize weekly range context, break quality, retest behavior, target room, and invalidation risk into a clean visual workflow.
🎯 Purpose & Design Philosophy
Weekly highs and weekly lows are widely watched reference points, but not every break beyond them is meaningful.
This script was built for traders who want to separate a clean weekly range break from a weak expansion, failed breakout, or noisy return back into the prior range.
The design supports structured observation: range first, break quality second, retest behavior third, and action state last.
⚡ Why This Script Is Different
Most tools mark weekly highs and lows or show simple breakout signals.
This script does NOT stop at drawing weekly levels.
Instead, it evaluates what happens after price breaks the range: whether the break has enough close quality, whether the retest shelf is respected, whether target room remains, and whether the context is still valid.
⚙️ Methodology
1. Previous Weekly Range Mapping
2. Break Boundary Detection
3. Retest Shelf Construction
4. Break Quality Scoring
5. Target Room Evaluation
6. Invalidation And Expiration Handling
7. Panel And Alert Output
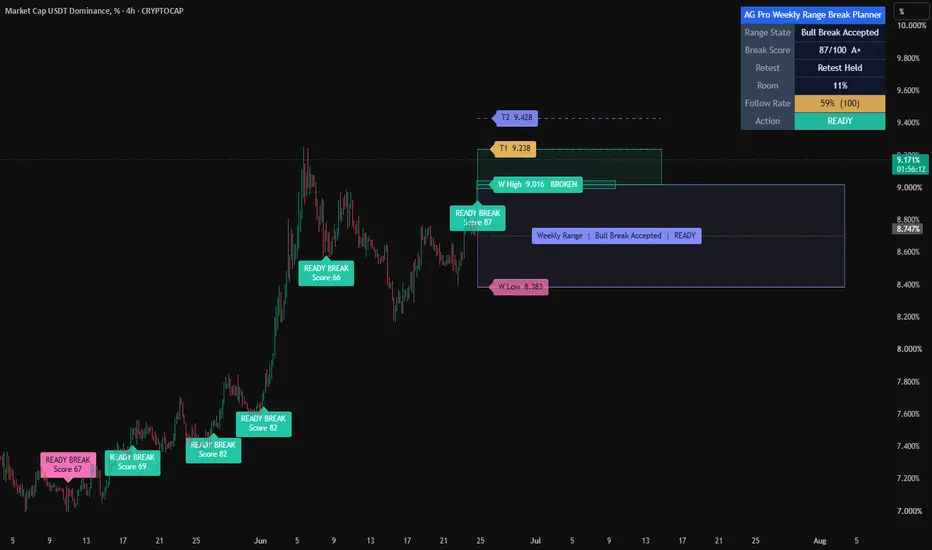
🗺️ How to Read the Chart
The weekly range box marks the previous week's high-low structure.
The high and low rails show the main break boundaries.
The midpoint line helps users understand where price is relative to the prior weekly balance.
The retest shelf appears around the broken boundary after a weekly range break.
READY BREAK labels appear when the break context meets the required score threshold.
Target rails show projected continuation references after a qualified break.
The panel summarizes Range State, Break Score, Retest, Room, and Action.
🚦 Signals & States
• READY → A qualified weekly range break has formed.
• MONITOR → Price has broken a weekly boundary and the script is evaluating quality.
• WAIT → The previous weekly range is valid, but no active break context is present.
• INVALIDATED → Price failed back inside the weekly range after a break.
• EXPIRED → The break window closed without a qualified context.
• BLOCKED → The previous weekly range is not suitable for evaluation.
🔔 Alerts Logic
Bullish Weekly Range Break Ready triggers when price breaks above the previous weekly high with enough quality.
Bearish Weekly Range Break Ready triggers when price breaks below the previous weekly low with enough quality.
Weekly Range Break Invalidated triggers when price fails back inside the prior weekly range after a break.
Weekly Range Break Expired triggers when the evaluation window closes without a qualified break state.
Alerts are attention markers, not trade instructions.
🧩 Confluence Logic
The break score combines weekly range fit, close distance beyond the boundary, retest shelf behavior, time quality, relative volume, and available target room.
When these elements align, the context becomes stronger.
When they do not align, the script remains in WAIT, MONITOR, INVALIDATED, EXPIRED, or BLOCKED state.
📊 When to Use
• Weekly high and weekly low break analysis
• Breakout-retest workflows
• Intraday monitoring around prior weekly extremes
• Swing context planning
• Trend continuation after a range expansion
⚠️ When NOT to Use
Avoid relying on this script in extremely low-liquidity markets, very noisy symbols, holiday sessions, or conditions where the previous weekly range is not meaningful.
It should not be used as a standalone decision tool without broader market context, risk planning, and independent confirmation.
🎛️ Key Inputs
• Minimum Weekly Range filters weak or compressed prior weekly ranges.
• Break Buffer ATR controls how far price must close beyond the weekly boundary.
• Retest Shelf ATR controls the depth of the shelf around the broken boundary.
• Invalidation Buffer ATR controls how far price must close back inside the range before invalidation.
• Minimum Ready Score controls how strong the score must be before READY appears.
• Target inputs define continuation reference rails from the broken boundary.
• Visual settings control boxes, rails, labels, right-side tags, panel location, and font size.
🖥️ Interface & Visual Design
The interface is designed to make the weekly range context readable at a glance.
The chart shows the prior weekly range, the active break boundary, the retest shelf, and target-room references without turning the screen into a generic breakout overlay.
The AG Pro panel gives compact decision context while preserving chart visibility.
🧪 Practical Usage Workflow
1. Check whether the previous weekly range is valid.
2. Watch for a close beyond the weekly high or low.
3. Observe the retest shelf around the broken boundary.
4. Read the break score, retest state, and room value.
5. Treat READY as an attention state and confirm with broader market context.
🔍 Interpretation Guidelines
A higher break score means the weekly range break is cleaner according to the script logic.
A clean retest shelf response can strengthen the context.
Low remaining room means the move may already be extended relative to the projected target.
READY means the context deserves attention, not that price must continue.
🚫 What This Script Is NOT
This script is not a prediction engine.
It is not financial advice.
It is not an auto-trading system.
It does not provide guaranteed signals.
It does not replace risk management or independent analysis.
⚠️ Limitations & Transparency
Weekly range behavior changes across markets, timeframes, volatility regimes, and liquidity conditions.
The score is rule-based and depends on current chart timeframe, ATR normalization, volume behavior, and the previous weekly range.
Different symbols may require different sensitivity settings.
🧠 Market Context Notes
Weekly range breaks can be more meaningful when aligned with trend, liquidity response, volume participation, and clean retest behavior.
Breaks that quickly return inside the prior weekly range often need extra caution.
🔐 Non-Promise Statement
No script can guarantee future price behavior.
This tool provides structured visual context only.
📉 Risk Disclosure
Trading involves risk.
Users remain responsible for their own decisions.
This script is for educational and analytical purposes only and does not provide financial advice or guaranteed trading outcomes.
🧠 Core Idea
Is the weekly range break strong enough to monitor, or is price likely to fail back inside the range?
📌 Overview / What it does
Weekly Range Break Planner is a weekly range decision-support script built to evaluate whether price is breaking beyond the previous week's high or low with enough structural quality.
The script maps the previous weekly high, low, and midpoint, detects bullish or bearish breaks, builds a retest shelf around the broken boundary, scores the break from 0 to 100, and summarizes the current state inside a compact AG Pro panel.
It does not predict price direction, automate trades, or provide guaranteed signals. It is designed to organize weekly range context, break quality, retest behavior, target room, and invalidation risk into a clean visual workflow.
🎯 Purpose & Design Philosophy
Weekly highs and weekly lows are widely watched reference points, but not every break beyond them is meaningful.
This script was built for traders who want to separate a clean weekly range break from a weak expansion, failed breakout, or noisy return back into the prior range.
The design supports structured observation: range first, break quality second, retest behavior third, and action state last.
⚡ Why This Script Is Different
Most tools mark weekly highs and lows or show simple breakout signals.
This script does NOT stop at drawing weekly levels.
Instead, it evaluates what happens after price breaks the range: whether the break has enough close quality, whether the retest shelf is respected, whether target room remains, and whether the context is still valid.
⚙️ Methodology
1. Previous Weekly Range Mapping
2. Break Boundary Detection
3. Retest Shelf Construction
4. Break Quality Scoring
5. Target Room Evaluation
6. Invalidation And Expiration Handling
7. Panel And Alert Output
🗺️ How to Read the Chart
The weekly range box marks the previous week's high-low structure.
The high and low rails show the main break boundaries.
The midpoint line helps users understand where price is relative to the prior weekly balance.
The retest shelf appears around the broken boundary after a weekly range break.
READY BREAK labels appear when the break context meets the required score threshold.
Target rails show projected continuation references after a qualified break.
The panel summarizes Range State, Break Score, Retest, Room, and Action.
🚦 Signals & States
• READY → A qualified weekly range break has formed.
• MONITOR → Price has broken a weekly boundary and the script is evaluating quality.
• WAIT → The previous weekly range is valid, but no active break context is present.
• INVALIDATED → Price failed back inside the weekly range after a break.
• EXPIRED → The break window closed without a qualified context.
• BLOCKED → The previous weekly range is not suitable for evaluation.
🔔 Alerts Logic
Bullish Weekly Range Break Ready triggers when price breaks above the previous weekly high with enough quality.
Bearish Weekly Range Break Ready triggers when price breaks below the previous weekly low with enough quality.
Weekly Range Break Invalidated triggers when price fails back inside the prior weekly range after a break.
Weekly Range Break Expired triggers when the evaluation window closes without a qualified break state.
Alerts are attention markers, not trade instructions.
🧩 Confluence Logic
The break score combines weekly range fit, close distance beyond the boundary, retest shelf behavior, time quality, relative volume, and available target room.
When these elements align, the context becomes stronger.
When they do not align, the script remains in WAIT, MONITOR, INVALIDATED, EXPIRED, or BLOCKED state.
📊 When to Use
• Weekly high and weekly low break analysis
• Breakout-retest workflows
• Intraday monitoring around prior weekly extremes
• Swing context planning
• Trend continuation after a range expansion
⚠️ When NOT to Use
Avoid relying on this script in extremely low-liquidity markets, very noisy symbols, holiday sessions, or conditions where the previous weekly range is not meaningful.
It should not be used as a standalone decision tool without broader market context, risk planning, and independent confirmation.
🎛️ Key Inputs
• Minimum Weekly Range filters weak or compressed prior weekly ranges.
• Break Buffer ATR controls how far price must close beyond the weekly boundary.
• Retest Shelf ATR controls the depth of the shelf around the broken boundary.
• Invalidation Buffer ATR controls how far price must close back inside the range before invalidation.
• Minimum Ready Score controls how strong the score must be before READY appears.
• Target inputs define continuation reference rails from the broken boundary.
• Visual settings control boxes, rails, labels, right-side tags, panel location, and font size.
🖥️ Interface & Visual Design
The interface is designed to make the weekly range context readable at a glance.
The chart shows the prior weekly range, the active break boundary, the retest shelf, and target-room references without turning the screen into a generic breakout overlay.
The AG Pro panel gives compact decision context while preserving chart visibility.
🧪 Practical Usage Workflow
1. Check whether the previous weekly range is valid.
2. Watch for a close beyond the weekly high or low.
3. Observe the retest shelf around the broken boundary.
4. Read the break score, retest state, and room value.
5. Treat READY as an attention state and confirm with broader market context.
🔍 Interpretation Guidelines
A higher break score means the weekly range break is cleaner according to the script logic.
A clean retest shelf response can strengthen the context.
Low remaining room means the move may already be extended relative to the projected target.
READY means the context deserves attention, not that price must continue.
🚫 What This Script Is NOT
This script is not a prediction engine.
It is not financial advice.
It is not an auto-trading system.
It does not provide guaranteed signals.
It does not replace risk management or independent analysis.
⚠️ Limitations & Transparency
Weekly range behavior changes across markets, timeframes, volatility regimes, and liquidity conditions.
The score is rule-based and depends on current chart timeframe, ATR normalization, volume behavior, and the previous weekly range.
Different symbols may require different sensitivity settings.
🧠 Market Context Notes
Weekly range breaks can be more meaningful when aligned with trend, liquidity response, volume participation, and clean retest behavior.
Breaks that quickly return inside the prior weekly range often need extra caution.
🔐 Non-Promise Statement
No script can guarantee future price behavior.
This tool provides structured visual context only.
📉 Risk Disclosure
Trading involves risk.
Users remain responsible for their own decisions.
This script is for educational and analytical purposes only and does not provide financial advice or guaranteed trading outcomes.
Notes de version
UPDATE NOTES - V1.3This update focuses on right-side tag separation, screenshot readability, and final visual polish.
The core purpose of the script remains unchanged.
This release improves how the existing logic is presented, organized, and interpreted on the chart.
This script continues to function as an analytical and visualization tool.
It does not attempt to predict price direction or provide guaranteed outcomes.
------------------------
What Changed
------------------------
• Added Right Tag Minimum Gap ATR
Right-side labels now use an ATR-based minimum vertical gap to reduce overlap between nearby tags such as W Low and T2.
• Improved target tag placement
T1 and T2 tags receive small horizontal offsets and collision-aware vertical placement when they sit too close to range boundary tags.
• Preserved V1.2 label-density improvements
Event Label Cooldown and the reduced default historical label count remain unchanged.
• Preserved the original weekly range break engine
No changes were made to range detection, break scoring, retest logic, READY logic, invalidation, expiration, target rails, or alerts.
------------------------
Visual Improvements
------------------------
• Reduced right-edge tag collisions on 1D and 4H screenshots.
• Improved readability when target rails sit close to weekly high or weekly low tags.
• Kept the centered weekly range badge, retest shelf, target rails, and AGPro panel visual identity intact.
• Maintained the single merged blue panel header row.
------------------------
Interface & Usability
------------------------
• Added Right Tag Minimum Gap ATR for fine control of right-side tag separation.
• Existing controls for centered range label placement, right-side tag offset, event label cooldown, panel location, panel theme, panel font size, and label font size remain unchanged.
------------------------
Behavior Notes
------------------------
This update does not change the core analytical logic of the script.
The goal is to improve clarity and usability, not to introduce new predictive behavior.
Users should interpret outputs the same way as before, but with cleaner right-side tag placement.
------------------------
Limitations Reminder
------------------------
The script remains a rule-based analytical tool.
Weekly range behavior may differ across symbols, liquidity conditions, volatility regimes, and intraday timeframes.
Outputs should always be interpreted within broader market context.
------------------------
Risk Reminder
------------------------
This script is for educational and analytical purposes only.
It does not provide financial advice or guaranteed trading outcomes.
Users remain responsible for their own decisions.
Notes de version
🔧 UPDATE NOTES - v1.4This update focuses on readability, visual coherence, and follow-through transparency.
The core purpose of the script remains unchanged.
This release improves how the existing weekly-break logic is presented, organized, and interpreted on the chart, and adds a stop-aware Follow Rate so the break context can be reviewed against its own history.
This script continues to function as an analytical and visualization tool.
It does not attempt to predict price direction or provide guaranteed outcomes.
------------------------
What Changed
------------------------
• Coherent break reference frame
The weekly high, weekly low, broken edge, projected targets, and right-side tags are now anchored to a single latched reference taken at the moment of the break. Previously the broken edge could drift out of sync with the live weekly range after a week boundary, so the broken edge and the displayed weekly low could disagree. They now always describe the same range.
• New Follow Rate row (stop-aware proof)
A new panel row reports how often past READY breaks reached the first target (T1) before closing back inside the range past the invalidation buffer. It is evaluated only on confirmed bars, the previous case is resolved before a new one opens, unresolved cases that time out are left uncounted, and the value reads "Building (n)" until at least 6 samples exist. The number is color-graded by tier.
• Adaptive text contrast on every badge
On-chart labels, right-side tags, the centered range badge, the Follow Rate cell, and the Action cell now choose dark or light text automatically based on the badge color, so gold, pink, and indigo badges stay legible at a glance.
• Removed redundant elements
The standalone "Break Edge" tag and the duplicate edge line were removed because the broken boundary always coincides with the weekly high or low. The broken side is now marked directly on the weekly high or low tag instead, reducing clutter.
• Full right-tag overlap scrub
Right-side tags (weekly high, weekly low, T1, T2) are spaced with a generalized vertical de-collision pass in their correct top-to-bottom order, so the weekly low and T2 no longer overlap. Default tag spacing and label offset were increased for cleaner separation.
------------------------
Visual Improvements
------------------------
• Improved chart readability by aligning the weekly range, edge, and targets to one consistent reference.
• Reduced visual clutter by removing the redundant edge tag and edge line.
• Refined visual hierarchy so the broken boundary, targets, and action stand out more clearly.
• Adjusted positioning and spacing of right-side tags to avoid overlap with each other and with candles.
------------------------
Interface & Usability
------------------------
• Optimized the panel with a dedicated Follow Rate row placed between Room and Action for a clearer information flow.
• Improved label and tag legibility with automatic, contrast-aware text color.
• Adjusted default visual settings (tag spacing and label offset) for a more balanced appearance.
• Enhanced overall user experience without changing the core break-detection logic.
------------------------
Behavior Notes
------------------------
This update does not change the core analytical logic of the script.
The break score, retest evaluation, target projection, and state machine work as before. The reference-frame fix only makes the displayed levels internally consistent; the Follow Rate is a descriptive, backward-looking statistic and is not a signal or instruction.
Users should interpret outputs the same way as before, now with improved visual structure and an added context statistic.
------------------------
Limitations Reminder
------------------------
The script remains a rule-based analytical tool.
Market conditions such as volatility, liquidity, and timeframe differences may affect how breaks, retests, and the Follow Rate appear. The Follow Rate reflects only the conditions seen in the loaded history on the current symbol and timeframe and will vary between instruments and chart settings.
Outputs should always be interpreted within broader market context.
------------------------
Risk Reminder
------------------------
This script is for educational and analytical purposes only.
It does not provide financial advice or guaranteed trading outcomes.
Users remain responsible for their own decisions.
Script open-source
Dans l'esprit TradingView, le créateur de ce script l'a rendu open source afin que les traders puissent examiner et vérifier ses fonctionnalités. Bravo à l'auteur! Bien que vous puissiez l'utiliser gratuitement, n'oubliez pas que la republication du code est soumise à nos Règles.

Public-free scripts + invite-only AGPro workflows for market analysis, liquidity context, risk planning and execution review.
Rules-based. No hype. No guesswork.
Library & access: agprolabs.com/
Telegram: t.me/agprolabs
Rules-based. No hype. No guesswork.
Library & access: agprolabs.com/
Telegram: t.me/agprolabs
Clause de non-responsabilité
Les informations et publications ne sont pas destinées à être, et ne constituent pas, des conseils ou recommandations financiers, d'investissement, de trading ou autres fournis ou approuvés par TradingView. Pour en savoir plus, consultez les Conditions d'utilisation.
Script open-source
Dans l'esprit TradingView, le créateur de ce script l'a rendu open source afin que les traders puissent examiner et vérifier ses fonctionnalités. Bravo à l'auteur! Bien que vous puissiez l'utiliser gratuitement, n'oubliez pas que la republication du code est soumise à nos Règles.
Public-free scripts + invite-only AGPro workflows for market analysis, liquidity context, risk planning and execution review.
Rules-based. No hype. No guesswork.
Library & access: agprolabs.com/
Telegram: t.me/agprolabs
Rules-based. No hype. No guesswork.
Library & access: agprolabs.com/
Telegram: t.me/agprolabs
Clause de non-responsabilité
Les informations et publications ne sont pas destinées à être, et ne constituent pas, des conseils ou recommandations financiers, d'investissement, de trading ou autres fournis ou approuvés par TradingView. Pour en savoir plus, consultez les Conditions d'utilisation.