Beta-Adjusted Strength [ThetaLoop]
A worked example first.
Over the last 20 sessions:
- Stock: -21%
- Nasdaq 100 (QQQ): -8%
- The stock's beta to QQQ: 2.4
The move you would expect from beta alone is about -18%. The actual move was -21%. The beta-adjusted move is about -3%.
So the stock did not break. It did almost exactly what a 2.4-beta stock does when the index drops 8%. Nothing company-specific happened. It is the market, amplified.
Now change one number. Same index drop, but the stock's beta is 0.9. Expected: about -7%. Actual: -21%. Beta-adjusted: about -14%. That is a stock-specific story, and you want to know about it before you buy that dip.
This indicator does that arithmetic on every bar and puts the result into statistical context.
What it calculates
1. Beta from log returns over the beta window (default 60 bars): beta = correlation x stdev(stock) / stdev(benchmark)
2. The residual of every bar: stock return minus beta x benchmark return. The beta of the previous bar is used, so the current bar cannot contaminate its own estimate.
3. The residuals are summed over the measurement window (default 20 bars) and normalized:
z = sum of residuals / (stdev of residuals x square root of window)
The z-score answers a precise question: how unusual is this stock-specific move, given how much stock-specific noise this symbol normally produces? A volatile small cap and a sleepy large cap become comparable on the same scale.
Reading it
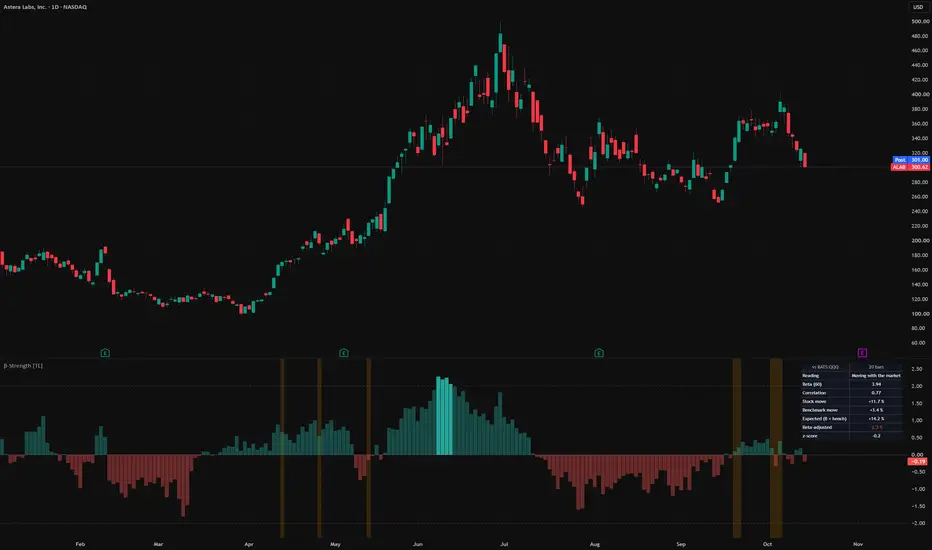
- Columns above +2: outperformance beyond what beta explains. Real relative strength.
- Columns below -2: weakness beyond what beta explains. Something other than the market is hitting the stock.
- Columns near zero during a sharp drop: the drop is beta.
- Faded columns: same direction, but below the threshold.
The table opens with a plain-language reading (moving with the market, slightly stronger or weaker than beta, stock-specific strength or weakness) and then spells out the example from above for the current bar: beta as used in the calculation, correlation, stock move, benchmark move, expected move (beta x benchmark), beta-adjusted move and the z-score.
Breadth check
An orange background marks bars where the benchmark closes at a new N-bar high while its equal-weight counterpart (QQQE by default) is still more than the tolerance below its own high. That is a rally carried by a few heavyweights. Useful context when the index looks fine but most of your watchlist does not.
Alerts
- Beta-adjusted weakness: z crosses below the lower threshold
- Beta-adjusted strength: z crosses above the upper threshold
- Breadth non-confirmation: first bar of a new non-confirmed high
Things to keep in mind
- Beta only means something when correlation does. With correlation below roughly 0.3, the "expected" move is weak, and the z-score is closer to plain relative performance.
- Choose a benchmark that trades in the same session as the symbol (QQQ, SMH, SPY for US stocks). Against a crypto chart, weekends show a flat benchmark.
- An earnings gap stays inside the measurement window until it rolls out. That is correct (an earnings reaction is stock-specific) but remember why the reading is extreme.
- Windows are counted in bars, so the script works on any timeframe. Defaults are tuned for daily charts.
Over the last 20 sessions:
- Stock: -21%
- Nasdaq 100 (QQQ): -8%
- The stock's beta to QQQ: 2.4
The move you would expect from beta alone is about -18%. The actual move was -21%. The beta-adjusted move is about -3%.
So the stock did not break. It did almost exactly what a 2.4-beta stock does when the index drops 8%. Nothing company-specific happened. It is the market, amplified.
Now change one number. Same index drop, but the stock's beta is 0.9. Expected: about -7%. Actual: -21%. Beta-adjusted: about -14%. That is a stock-specific story, and you want to know about it before you buy that dip.
This indicator does that arithmetic on every bar and puts the result into statistical context.
What it calculates
1. Beta from log returns over the beta window (default 60 bars): beta = correlation x stdev(stock) / stdev(benchmark)
2. The residual of every bar: stock return minus beta x benchmark return. The beta of the previous bar is used, so the current bar cannot contaminate its own estimate.
3. The residuals are summed over the measurement window (default 20 bars) and normalized:
z = sum of residuals / (stdev of residuals x square root of window)
The z-score answers a precise question: how unusual is this stock-specific move, given how much stock-specific noise this symbol normally produces? A volatile small cap and a sleepy large cap become comparable on the same scale.
Reading it
- Columns above +2: outperformance beyond what beta explains. Real relative strength.
- Columns below -2: weakness beyond what beta explains. Something other than the market is hitting the stock.
- Columns near zero during a sharp drop: the drop is beta.
- Faded columns: same direction, but below the threshold.
The table opens with a plain-language reading (moving with the market, slightly stronger or weaker than beta, stock-specific strength or weakness) and then spells out the example from above for the current bar: beta as used in the calculation, correlation, stock move, benchmark move, expected move (beta x benchmark), beta-adjusted move and the z-score.
Breadth check
An orange background marks bars where the benchmark closes at a new N-bar high while its equal-weight counterpart (QQQE by default) is still more than the tolerance below its own high. That is a rally carried by a few heavyweights. Useful context when the index looks fine but most of your watchlist does not.
Alerts
- Beta-adjusted weakness: z crosses below the lower threshold
- Beta-adjusted strength: z crosses above the upper threshold
- Breadth non-confirmation: first bar of a new non-confirmed high
Things to keep in mind
- Beta only means something when correlation does. With correlation below roughly 0.3, the "expected" move is weak, and the z-score is closer to plain relative performance.
- Choose a benchmark that trades in the same session as the symbol (QQQ, SMH, SPY for US stocks). Against a crypto chart, weekends show a flat benchmark.
- An earnings gap stays inside the measurement window until it rolls out. That is correct (an earnings reaction is stock-specific) but remember why the reading is extreme.
- Windows are counted in bars, so the script works on any timeframe. Defaults are tuned for daily charts.

ThetaLoop | Algorithmic Options Research
🔍 Free CSP Score for any ticker — X-Ray Scanner:
thetaloop.app/xray
(Not financial advice)
🔍 Free CSP Score for any ticker — X-Ray Scanner:
thetaloop.app/xray
(Not financial advice)
Clause de non-responsabilité
Les informations et publications ne sont pas destinées à être, et ne constituent pas, des conseils ou recommandations financiers, d'investissement, de trading ou autres fournis ou approuvés par TradingView. Pour en savoir plus, consultez les Conditions d'utilisation.
ThetaLoop | Algorithmic Options Research
🔍 Free CSP Score for any ticker — X-Ray Scanner:
thetaloop.app/xray
(Not financial advice)
🔍 Free CSP Score for any ticker — X-Ray Scanner:
thetaloop.app/xray
(Not financial advice)
Clause de non-responsabilité
Les informations et publications ne sont pas destinées à être, et ne constituent pas, des conseils ou recommandations financiers, d'investissement, de trading ou autres fournis ou approuvés par TradingView. Pour en savoir plus, consultez les Conditions d'utilisation.