OPEN-SOURCE SCRIPT
Bull Market Support Band + Dual Weekly Divergences
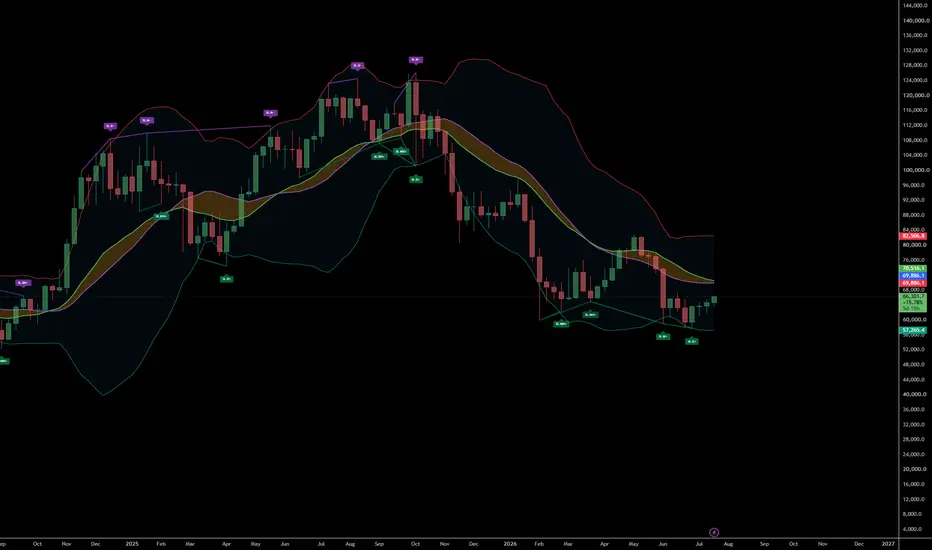
Bull Market Support Band + Weekly Divergences
The Bull Market Support Band + Weekly Divergences expands the classic 20-Week SMA / 21-Week EMA Bull Market Support Band with a powerful divergence engine designed to help identify weakening trends, potential reversals and trend continuation on the weekly timeframe.
Instead of relying only on price crossing the support band, this indicator looks for situations where price begins to disagree with momentum or the behaviour of the support band itself, often providing earlier warnings of important market turning points.
Features
• Classic Bull Market Support Band (20W SMA & 21W EMA)
• Weekly calculations on any chart timeframe
• Simultaneous divergence detection using:
2 Left / 1 Right pivots
3 Left / 1 Right pivots
• Regular and Hidden divergences
• Four independent divergence engines:
RSI Divergences
Band Distance Divergences
Band Momentum Divergences
Band Width Divergences
• Individual enable/disable switches for every divergence family
• Optional divergence trend lines
• Compact chart labels with detailed hover explanations
• Bullish and bearish alerts
Divergence Types
RSI Divergence
Compares weekly price with weekly RSI.
Useful for detecting:
Momentum exhaustion
Early reversals
Trend continuation
Band Distance Divergence
Measures how far price is from the Bull Market Support Band.
Useful for identifying:
Weak breakouts
Weak breakdowns
Improving relative strength
Fading macro momentum
Band Momentum Divergence
Measures the rate of change of the support band itself.
This can reveal situations where:
Price continues making new highs while the support band loses momentum.
Price makes new lows while the macro trend is already stabilising.
Band Width Divergence
Monitors the distance between the weekly SMA and EMA.
Useful for spotting:
Trend compression
Expansion
Potential regime changes
Loss of long-term trend strength
Signal Labels
Signals remain intentionally short to keep charts clean.
Examples:
2L R+
2 Left / 1 Right RSI Regular Bullish Divergence
3L RH−
3 Left / 1 Right RSI Hidden Bearish Divergence
2L D+
Band Distance Regular Bullish Divergence
3L M−
Band Momentum Regular Bearish Divergence
WH
Band Width Hidden Divergence
Hover your mouse over any signal to view a detailed explanation of what it represents and why it was generated.
Pivot Detection
The indicator evaluates two weekly pivot structures simultaneously:
2 Left / 1 Right — earlier signals with higher sensitivity.
3 Left / 1 Right — more selective signals with stronger confirmation.
This lets traders compare faster and more conservative divergence setups without switching settings.
Best Used For
Bitcoin
Crypto markets
Long-term trend analysis
Macro cycle analysis
Swing trading
Position trading
Although optimized for cryptocurrencies, it can also be applied to stocks, indices, commodities and other markets.
Disclaimer
This indicator highlights potential divergence conditions. Divergences do not guarantee reversals or trend continuation and should be used alongside market structure, volume, support and resistance, and sound risk management.
The Bull Market Support Band + Weekly Divergences expands the classic 20-Week SMA / 21-Week EMA Bull Market Support Band with a powerful divergence engine designed to help identify weakening trends, potential reversals and trend continuation on the weekly timeframe.
Instead of relying only on price crossing the support band, this indicator looks for situations where price begins to disagree with momentum or the behaviour of the support band itself, often providing earlier warnings of important market turning points.
Features
• Classic Bull Market Support Band (20W SMA & 21W EMA)
• Weekly calculations on any chart timeframe
• Simultaneous divergence detection using:
2 Left / 1 Right pivots
3 Left / 1 Right pivots
• Regular and Hidden divergences
• Four independent divergence engines:
RSI Divergences
Band Distance Divergences
Band Momentum Divergences
Band Width Divergences
• Individual enable/disable switches for every divergence family
• Optional divergence trend lines
• Compact chart labels with detailed hover explanations
• Bullish and bearish alerts
Divergence Types
RSI Divergence
Compares weekly price with weekly RSI.
Useful for detecting:
Momentum exhaustion
Early reversals
Trend continuation
Band Distance Divergence
Measures how far price is from the Bull Market Support Band.
Useful for identifying:
Weak breakouts
Weak breakdowns
Improving relative strength
Fading macro momentum
Band Momentum Divergence
Measures the rate of change of the support band itself.
This can reveal situations where:
Price continues making new highs while the support band loses momentum.
Price makes new lows while the macro trend is already stabilising.
Band Width Divergence
Monitors the distance between the weekly SMA and EMA.
Useful for spotting:
Trend compression
Expansion
Potential regime changes
Loss of long-term trend strength
Signal Labels
Signals remain intentionally short to keep charts clean.
Examples:
2L R+
2 Left / 1 Right RSI Regular Bullish Divergence
3L RH−
3 Left / 1 Right RSI Hidden Bearish Divergence
2L D+
Band Distance Regular Bullish Divergence
3L M−
Band Momentum Regular Bearish Divergence
WH
Band Width Hidden Divergence
Hover your mouse over any signal to view a detailed explanation of what it represents and why it was generated.
Pivot Detection
The indicator evaluates two weekly pivot structures simultaneously:
2 Left / 1 Right — earlier signals with higher sensitivity.
3 Left / 1 Right — more selective signals with stronger confirmation.
This lets traders compare faster and more conservative divergence setups without switching settings.
Best Used For
Bitcoin
Crypto markets
Long-term trend analysis
Macro cycle analysis
Swing trading
Position trading
Although optimized for cryptocurrencies, it can also be applied to stocks, indices, commodities and other markets.
Disclaimer
This indicator highlights potential divergence conditions. Divergences do not guarantee reversals or trend continuation and should be used alongside market structure, volume, support and resistance, and sound risk management.
Script open-source
Dans l'esprit TradingView, le créateur de ce script l'a rendu open source afin que les traders puissent examiner et vérifier ses fonctionnalités. Bravo à l'auteur! Bien que vous puissiez l'utiliser gratuitement, n'oubliez pas que la republication du code est soumise à nos Règles.

Clause de non-responsabilité
Les informations et publications ne sont pas destinées à être, et ne constituent pas, des conseils ou recommandations financiers, d'investissement, de trading ou autres fournis ou approuvés par TradingView. Pour en savoir plus, consultez les Conditions d'utilisation.
Script open-source
Dans l'esprit TradingView, le créateur de ce script l'a rendu open source afin que les traders puissent examiner et vérifier ses fonctionnalités. Bravo à l'auteur! Bien que vous puissiez l'utiliser gratuitement, n'oubliez pas que la republication du code est soumise à nos Règles.
Clause de non-responsabilité
Les informations et publications ne sont pas destinées à être, et ne constituent pas, des conseils ou recommandations financiers, d'investissement, de trading ou autres fournis ou approuvés par TradingView. Pour en savoir plus, consultez les Conditions d'utilisation.