OPEN-SOURCE SCRIPT
Supertrend Twincore [MachineSuiteAI]
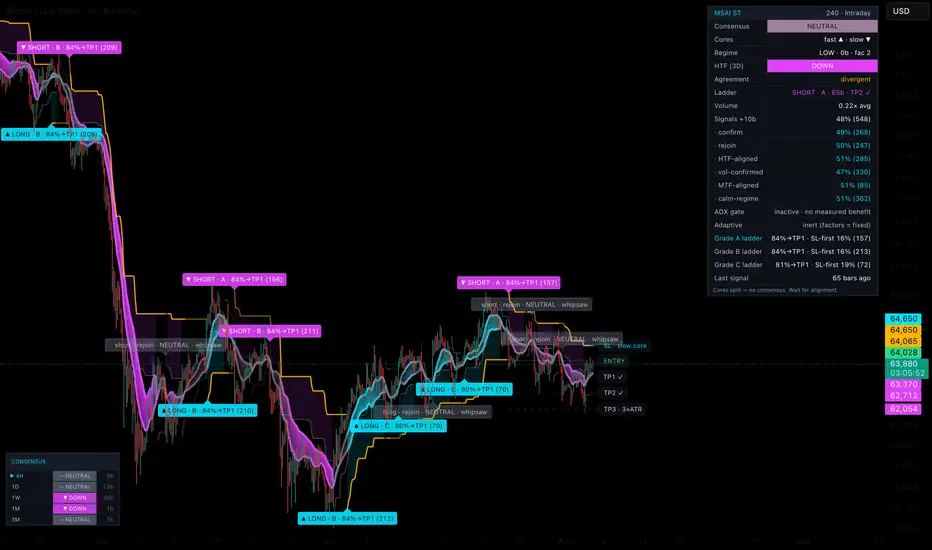
Supertrend Twincore [MachineSuiteAI]
🟦 OVERVIEW
A fast Supertrend flips too often; a slow one flips too late. This script runs both at once and only signals when they agree — and then shows you, with win rates and sample sizes, how that agreement has actually performed on the chart you have loaded.
A signal only appears where the fast core (timing) and the slow core (structure) first align, and only if it passes a gate: clustered whipsaw flips always suppress, and every other filter blocks signals only where measurement shows it helps on this chart. Passed signals are graded A/B/C and draw an Entry / SL / TP1-3 ladder whose outcomes are tracked per grade. Suppressed candidates stay as grey ghost chips with the reason, and a five-row multi-timeframe strip shows the consensus state across timeframes from completed bars.
The idea throughout: the chart never claims more than the data supports, and anything the script believes is checkable in the panel.
🟦 WHAT IS A SUPERTREND?

Supertrend is a public-domain trailing-stop indicator: it offsets price by a multiple of the Average True Range and trails that stop behind the trend. Price above the stop means uptrend, below means downtrend; a close across it flips the state. This script computes its cores with the built-in ta.supertrend() — fast 2.0 × ATR(10) and slow 4.0 × ATR(20) by default.
Its known weakness is structural: in ranging markets the stop is repeatedly crossed and the indicator whipsaws. Filters are the usual answer; this script measures whether each one actually helps on the loaded symbol and timeframe, and the marks and the gate act only on that evidence.
🟦 WHY THIS SCRIPT IS ORIGINAL

The base calculation is a built-in, and the ingredients — win-rate panels, ADX gates, higher-timeframe confirmation, multi-timeframe dashboards, take-profit ladders, signal grades — are established ideas. What's different is the standard everything must meet: beyond one fixed whipsaw rule, nothing gets drawn, nothing blocks a signal, and nothing drives the engine unless the measurements on the loaded chart back it up.
- Graded ladder odds with the cost attached. Grades are fixed and published — A means structural confirmation plus volume, B one of the two, C neither; no opaque score. Every passed signal's ladder is tracked to resolution; the panel shows per grade: TP1-before-SL and SL-first rates, the median furthest level, the median heat (largest adverse move, in ATR units) and the median bars to TP1, each with its own sample size.
- An adaptive engine that has to beat the fixed one first. Both fast cores — fixed and adaptive — are measured as separate signal streams on the loaded chart, and the adaptive core only drives signals while it beats the fixed core by a set margin with enough samples. The A/B row shows the running comparison; on defaults it reports the adaptive layer as inert.
- Gates held to the same standard. The ✓ volume mark and ⚠ counter-trend warning only print where their split beats the base win rate by a configurable margin here. The ADX gate only blocks candidates where high-ADX candidates have beaten low-ADX candidates by that margin on this chart.
- Per-condition win-rate splits. The base candidate win rate, then the same measurement split by signal class, higher-timeframe agreement, volume confirmation, multi-timeframe alignment and volatility regime — six statistics, each with its own sample size, greyed below a minimum sample.
- Two kinds of signals, measured separately. A candidate exists only on the first bar the cores align and is classified as a structural confirmation (the slow core just flipped in) or a pullback rejoin (the fast core returned to a standing slow trend); a double flip on one bar is labeled same-bar. They are different trades, measured separately.
- Suppression you can audit. A gated-out candidate still prints — a hollow grey ghost chip with the specific reason — and still counts in every statistic, so the base rate is never inflated by counting only the survivors.
- Visual discipline. The band claims a direction only while both cores agree; its saturation drains as price nears the structural stop, so the exit warning arrives before the flip; NEUTRAL keeps a directional tint, so the last trend stays readable while standing aside. The price scale is held to the same rule — it carries the structural stop and the ladder's Entry, SL and TP1-3, each in its own colour, and nothing else; the band and the fast core draw on the chart but claim no axis label. Every visual property maps to something measured.
🟦 HOW IT WORKS

- Cores: two standard Supertrends — the fast core times entries, the slow core defines structure and is the ladder's trailing stop. Presets: Scalp 1.5×ATR(7)/3.0×ATR(14), Intraday 2.0×ATR(10)/4.0×ATR(20), Swing 3.0×ATR(14)/5.0×ATR(28), or Custom.
- Gate and state model: flip-cluster suppression (2+ fast flips in 10 bars, on by default), the measured ADX gate (default "Where it helps (measured)"), and an optional strict higher-timeframe gate (off by default). The band turns grey NEUTRAL on low ADX (default ADX(14) < 20) or flip clustering.
- Higher-timeframe filter: a third Supertrend one regime up (auto-mapped ≤15m→4H, ≤1H→1D, ≤4H→3D, ≤1D→1W, else 1M; or manual), read from the last completed HTF bar.
- Statistics: on confirmed bars, every candidate — passed and suppressed — resolves N bars later (default 10); a win means the close moved in its direction. Splits grey below the minimum sample (default 20). Chip marks need their split to beat the base rate by ≥3 points (configurable); the ADX gate needs the high-ADX split to beat the low-ADX split by the same margin; volume confirmation is volume above 1.5× its 20-bar average.
- Ladder: at a passed signal's close, Entry is the close, SL is the slow-core stop (or the fast core, or a fixed k×ATR cap), TP1/2/3 default to 1/2/3 × ATR. It trails, marks TP touches ✓, freezes ✕ on an SL break, dims when resolved or consensus is lost, and feeds the per-grade LADDER ODDS rows. A live ladder tracks the right edge of the chart; once its stop is hit it stops there, so it stays a bounded record of that trade — targets it never reached are not credited later just because price eventually passed them, and the frozen right edge makes clear the trade was already over. The stop's ray spans only the stretch where that level was actually in force, because a trailing stop is a staircase rather than one line: on a long it starts below the entry and can ratchet above it, locking in profit, and the amber slow core shows the whole path. Each level prints its exact price on the price scale, so the figure for an order ticket reads straight off the axis while the chart labels stay short. The colours carry the geometry: entry green, the targets in the trade's own direction and the stop in the opposite hue, so the level that ends a trade never reads like the levels that pay it — and the slow core keeps its amber, so the stop stays distinguishable from the line it trails.
- Adaptive engine: a per-volatility-regime fast core A/B-measured against the fixed one, as described above; default factors are inert.
- MTF strip: five rows of full consensus state (UP / DOWN / SPLIT / NEUTRAL, with bars-in-state), each read from that timeframe's last completed bar. Auto mode starts at the chart's own timeframe and climbs — 4H gives 4H/D/W/M/3M. Lower timeframes are omitted by default: their consensus flips many times during a single trade taken here, so it says little about an outcome measured over days. Manual mode accepts any five, defaulting to the classic 15m/1H/4H/D/W.
🟦 HOW TO USE IT
- Read the panel first: consensus state, cores, regime, HTF agreement, then the measured rows. An ↑ means that condition has earned its margin on this chart; its absence means it hasn't.
- Chips carry their evidence: grade letter, live per-grade TP1 odds at sufficient sample, ✓ where volume has helped, ⚠ where fighting the higher timeframe has hurt. Ghost chips mean the script stood aside — the reason is on the chip.
- NEUTRAL and SPLIT mean stand aside. The coach line says this in plain language, and notes that a retouch of the entry after TP1 does not invalidate a live ladder — only the SL does.
- Reversal-only signal mode reserves the headline presentation for slow-core reversals; Discipline display mode strips the chart to the band alone (note: TP/SL alerts only fire while the ladder is drawn).
- Defaults are tuned on liquid crypto from 15-minute to weekly charts; the multipliers and ADX threshold are worth reviewing on other asset classes.
🟦 SETTINGS
Grouped as in the inputs dialog: consensus core (presets or custom multipliers) · higher-timeframe filter · state model & signal gate (ADX, flip-cluster, optional HTF gate, ghost chips) · trade ladder (SL geometry, TP multiples) · grade engine (certified or dynamic wiring) · adaptive engine · MTF strip · visuals and display modes · volume multiple (default 1.5×) · signal stats engine (horizon, minimum sample, gating margin) · JSON webhook alerts.
🟦 ALERTS
Consensus long / short · confirmed reversal long / short · Grade A long / short · TP1 / TP2 / TP3 touched · SL break · NEUTRAL started / ended · volatility regime changed · adaptive engagement changed. Create the classic alert conditions with "Once Per Bar Close" — they evaluate on live bars, and an intrabar state can revert before it counts. Optional JSON alert() events via a single "Any alert() function call" alert: signal events carry grade, entry and levels; TP/SL events identify the touched level; all carry symbol, timeframe, regime and state. The JSON events are close-gated and fire for every passed candidate, including rejoins the Reversal-only display mode demotes.
🟦 REPAINT & DATA NOTES
- All bookkeeping runs on confirmed bars; chips, ladders and statistics commit at bar close. Inside a forming bar the panel's consensus, cores, agreement, volume and coach line update live and are therefore PROVISIONAL — they can revert before the bar shuts. Price can also sit beyond a ladder's stop for the rest of a bar without resolving it: in the core SL modes the stop breaks when that core flips, which needs a confirmed close. The coach line says so when it happens.
- Higher-timeframe and strip values come from each timeframe's last completed bar — no repaint; intrabar changes up there show after that bar closes. The design assumes the HTF sits above the chart's timeframe — with Manual selection, keep it there.
- Ladder TP touches — and the Fixed mode's hard-stop touches — are detected from confirmed bars' highs/lows, starting the bar after entry; a bar touching several levels credits TPs before the stop. In the core SL modes the stop is not touch-based: it resolves only when its core flips, which needs a confirmed close — so a wick through the stop does not end a ladder, and the touch-credited TP rates are structurally friendlier than a hard-stop backtest of the same levels. The Fixed k×ATR mode is the geometry closest to a real hard stop.
- Statistics cover the loaded history and reset when the chart reloads with different history; lower timeframes load fewer bars. Greyed rows just mean the sample is too small to trust.
- Only the most recent 250 chips and ghost chips stay on the chart, so a live ladder's own labels can never be pushed off by TradingView's drawing limit; deep history keeps its band and cores but not its markers. Ladder odds count each ladder when it resolves, and in the rare case that more than 30 are open at once the oldest is counted at its current state rather than discarded — the sample is never silently trimmed.
- On a live bar the volume ratio is partial; judge it near the close. Volume features require a feed that supplies volume.
🟦 CREDITS
The Supertrend concept is public domain (popularized by Olivier Seban); ATR, ADX and the DMI are J. Welles Wilder's. The fixed cores use TradingView's built-in ta.supertrend(); the adaptive core re-implements the same algorithm to accept a per-bar factor. The consensus model, candidate classes, statistics engine, gates, grades, measured ladder, ghost chips, strip and band rendering were written from scratch for this script.
🟦 LIMITATIONS
- Supertrend lags by construction, and requiring two cores to agree makes entries later still — fewer, later, more heavily filtered signals is the intended trade-off.
- The NEUTRAL state derives from lagging measures (ADX, flip counts), so the first signals of a new trend can still arrive grey or be suppressed.
- All statistics are direction-only measurements over a fixed horizon; ladder odds are level measurements (TPs credit on a wick touch, core-mode stops resolve only on a confirmed core flip) — no fees, slippage, sizing or equity math. They are not a strategy backtest, they differ per symbol and timeframe, and they do not predict future outcomes.
- Without volume data the volume filter and its split stay inactive, and certified Grade A (confirmation + volume) is out of reach — signals cap at Grade B on volume-less feeds. Sample sizes on higher timeframes are structurally small; expect greyed rows there.
- The same asset on two different venues can show opposite states. A Supertrend flip is a threshold event: when price sits within a fraction of a percent of the band, a normal inter-exchange spread of a few basis points decides whether it crosses, and once one venue flips its stop jumps to the other side of price, so two nearly identical charts diverge sharply. This is inherent to the calculation, not a data error — treat a signal as belonging to the feed it was measured on, and check the panel's sample sizes on the venue you actually trade.
🟦 DISCLAIMER
This is an educational analysis tool, not investment advice. Historical measurements, however carefully computed, do not predict future results. Trading involves substantial risk.
🟦 OVERVIEW
A fast Supertrend flips too often; a slow one flips too late. This script runs both at once and only signals when they agree — and then shows you, with win rates and sample sizes, how that agreement has actually performed on the chart you have loaded.
A signal only appears where the fast core (timing) and the slow core (structure) first align, and only if it passes a gate: clustered whipsaw flips always suppress, and every other filter blocks signals only where measurement shows it helps on this chart. Passed signals are graded A/B/C and draw an Entry / SL / TP1-3 ladder whose outcomes are tracked per grade. Suppressed candidates stay as grey ghost chips with the reason, and a five-row multi-timeframe strip shows the consensus state across timeframes from completed bars.
The idea throughout: the chart never claims more than the data supports, and anything the script believes is checkable in the panel.
🟦 WHAT IS A SUPERTREND?
Supertrend is a public-domain trailing-stop indicator: it offsets price by a multiple of the Average True Range and trails that stop behind the trend. Price above the stop means uptrend, below means downtrend; a close across it flips the state. This script computes its cores with the built-in ta.supertrend() — fast 2.0 × ATR(10) and slow 4.0 × ATR(20) by default.
Its known weakness is structural: in ranging markets the stop is repeatedly crossed and the indicator whipsaws. Filters are the usual answer; this script measures whether each one actually helps on the loaded symbol and timeframe, and the marks and the gate act only on that evidence.
🟦 WHY THIS SCRIPT IS ORIGINAL
The base calculation is a built-in, and the ingredients — win-rate panels, ADX gates, higher-timeframe confirmation, multi-timeframe dashboards, take-profit ladders, signal grades — are established ideas. What's different is the standard everything must meet: beyond one fixed whipsaw rule, nothing gets drawn, nothing blocks a signal, and nothing drives the engine unless the measurements on the loaded chart back it up.
- Graded ladder odds with the cost attached. Grades are fixed and published — A means structural confirmation plus volume, B one of the two, C neither; no opaque score. Every passed signal's ladder is tracked to resolution; the panel shows per grade: TP1-before-SL and SL-first rates, the median furthest level, the median heat (largest adverse move, in ATR units) and the median bars to TP1, each with its own sample size.
- An adaptive engine that has to beat the fixed one first. Both fast cores — fixed and adaptive — are measured as separate signal streams on the loaded chart, and the adaptive core only drives signals while it beats the fixed core by a set margin with enough samples. The A/B row shows the running comparison; on defaults it reports the adaptive layer as inert.
- Gates held to the same standard. The ✓ volume mark and ⚠ counter-trend warning only print where their split beats the base win rate by a configurable margin here. The ADX gate only blocks candidates where high-ADX candidates have beaten low-ADX candidates by that margin on this chart.
- Per-condition win-rate splits. The base candidate win rate, then the same measurement split by signal class, higher-timeframe agreement, volume confirmation, multi-timeframe alignment and volatility regime — six statistics, each with its own sample size, greyed below a minimum sample.
- Two kinds of signals, measured separately. A candidate exists only on the first bar the cores align and is classified as a structural confirmation (the slow core just flipped in) or a pullback rejoin (the fast core returned to a standing slow trend); a double flip on one bar is labeled same-bar. They are different trades, measured separately.
- Suppression you can audit. A gated-out candidate still prints — a hollow grey ghost chip with the specific reason — and still counts in every statistic, so the base rate is never inflated by counting only the survivors.
- Visual discipline. The band claims a direction only while both cores agree; its saturation drains as price nears the structural stop, so the exit warning arrives before the flip; NEUTRAL keeps a directional tint, so the last trend stays readable while standing aside. The price scale is held to the same rule — it carries the structural stop and the ladder's Entry, SL and TP1-3, each in its own colour, and nothing else; the band and the fast core draw on the chart but claim no axis label. Every visual property maps to something measured.
🟦 HOW IT WORKS
- Cores: two standard Supertrends — the fast core times entries, the slow core defines structure and is the ladder's trailing stop. Presets: Scalp 1.5×ATR(7)/3.0×ATR(14), Intraday 2.0×ATR(10)/4.0×ATR(20), Swing 3.0×ATR(14)/5.0×ATR(28), or Custom.
- Gate and state model: flip-cluster suppression (2+ fast flips in 10 bars, on by default), the measured ADX gate (default "Where it helps (measured)"), and an optional strict higher-timeframe gate (off by default). The band turns grey NEUTRAL on low ADX (default ADX(14) < 20) or flip clustering.
- Higher-timeframe filter: a third Supertrend one regime up (auto-mapped ≤15m→4H, ≤1H→1D, ≤4H→3D, ≤1D→1W, else 1M; or manual), read from the last completed HTF bar.
- Statistics: on confirmed bars, every candidate — passed and suppressed — resolves N bars later (default 10); a win means the close moved in its direction. Splits grey below the minimum sample (default 20). Chip marks need their split to beat the base rate by ≥3 points (configurable); the ADX gate needs the high-ADX split to beat the low-ADX split by the same margin; volume confirmation is volume above 1.5× its 20-bar average.
- Ladder: at a passed signal's close, Entry is the close, SL is the slow-core stop (or the fast core, or a fixed k×ATR cap), TP1/2/3 default to 1/2/3 × ATR. It trails, marks TP touches ✓, freezes ✕ on an SL break, dims when resolved or consensus is lost, and feeds the per-grade LADDER ODDS rows. A live ladder tracks the right edge of the chart; once its stop is hit it stops there, so it stays a bounded record of that trade — targets it never reached are not credited later just because price eventually passed them, and the frozen right edge makes clear the trade was already over. The stop's ray spans only the stretch where that level was actually in force, because a trailing stop is a staircase rather than one line: on a long it starts below the entry and can ratchet above it, locking in profit, and the amber slow core shows the whole path. Each level prints its exact price on the price scale, so the figure for an order ticket reads straight off the axis while the chart labels stay short. The colours carry the geometry: entry green, the targets in the trade's own direction and the stop in the opposite hue, so the level that ends a trade never reads like the levels that pay it — and the slow core keeps its amber, so the stop stays distinguishable from the line it trails.
- Adaptive engine: a per-volatility-regime fast core A/B-measured against the fixed one, as described above; default factors are inert.
- MTF strip: five rows of full consensus state (UP / DOWN / SPLIT / NEUTRAL, with bars-in-state), each read from that timeframe's last completed bar. Auto mode starts at the chart's own timeframe and climbs — 4H gives 4H/D/W/M/3M. Lower timeframes are omitted by default: their consensus flips many times during a single trade taken here, so it says little about an outcome measured over days. Manual mode accepts any five, defaulting to the classic 15m/1H/4H/D/W.
🟦 HOW TO USE IT
- Read the panel first: consensus state, cores, regime, HTF agreement, then the measured rows. An ↑ means that condition has earned its margin on this chart; its absence means it hasn't.
- Chips carry their evidence: grade letter, live per-grade TP1 odds at sufficient sample, ✓ where volume has helped, ⚠ where fighting the higher timeframe has hurt. Ghost chips mean the script stood aside — the reason is on the chip.
- NEUTRAL and SPLIT mean stand aside. The coach line says this in plain language, and notes that a retouch of the entry after TP1 does not invalidate a live ladder — only the SL does.
- Reversal-only signal mode reserves the headline presentation for slow-core reversals; Discipline display mode strips the chart to the band alone (note: TP/SL alerts only fire while the ladder is drawn).
- Defaults are tuned on liquid crypto from 15-minute to weekly charts; the multipliers and ADX threshold are worth reviewing on other asset classes.
🟦 SETTINGS
Grouped as in the inputs dialog: consensus core (presets or custom multipliers) · higher-timeframe filter · state model & signal gate (ADX, flip-cluster, optional HTF gate, ghost chips) · trade ladder (SL geometry, TP multiples) · grade engine (certified or dynamic wiring) · adaptive engine · MTF strip · visuals and display modes · volume multiple (default 1.5×) · signal stats engine (horizon, minimum sample, gating margin) · JSON webhook alerts.
🟦 ALERTS
Consensus long / short · confirmed reversal long / short · Grade A long / short · TP1 / TP2 / TP3 touched · SL break · NEUTRAL started / ended · volatility regime changed · adaptive engagement changed. Create the classic alert conditions with "Once Per Bar Close" — they evaluate on live bars, and an intrabar state can revert before it counts. Optional JSON alert() events via a single "Any alert() function call" alert: signal events carry grade, entry and levels; TP/SL events identify the touched level; all carry symbol, timeframe, regime and state. The JSON events are close-gated and fire for every passed candidate, including rejoins the Reversal-only display mode demotes.
🟦 REPAINT & DATA NOTES
- All bookkeeping runs on confirmed bars; chips, ladders and statistics commit at bar close. Inside a forming bar the panel's consensus, cores, agreement, volume and coach line update live and are therefore PROVISIONAL — they can revert before the bar shuts. Price can also sit beyond a ladder's stop for the rest of a bar without resolving it: in the core SL modes the stop breaks when that core flips, which needs a confirmed close. The coach line says so when it happens.
- Higher-timeframe and strip values come from each timeframe's last completed bar — no repaint; intrabar changes up there show after that bar closes. The design assumes the HTF sits above the chart's timeframe — with Manual selection, keep it there.
- Ladder TP touches — and the Fixed mode's hard-stop touches — are detected from confirmed bars' highs/lows, starting the bar after entry; a bar touching several levels credits TPs before the stop. In the core SL modes the stop is not touch-based: it resolves only when its core flips, which needs a confirmed close — so a wick through the stop does not end a ladder, and the touch-credited TP rates are structurally friendlier than a hard-stop backtest of the same levels. The Fixed k×ATR mode is the geometry closest to a real hard stop.
- Statistics cover the loaded history and reset when the chart reloads with different history; lower timeframes load fewer bars. Greyed rows just mean the sample is too small to trust.
- Only the most recent 250 chips and ghost chips stay on the chart, so a live ladder's own labels can never be pushed off by TradingView's drawing limit; deep history keeps its band and cores but not its markers. Ladder odds count each ladder when it resolves, and in the rare case that more than 30 are open at once the oldest is counted at its current state rather than discarded — the sample is never silently trimmed.
- On a live bar the volume ratio is partial; judge it near the close. Volume features require a feed that supplies volume.
🟦 CREDITS
The Supertrend concept is public domain (popularized by Olivier Seban); ATR, ADX and the DMI are J. Welles Wilder's. The fixed cores use TradingView's built-in ta.supertrend(); the adaptive core re-implements the same algorithm to accept a per-bar factor. The consensus model, candidate classes, statistics engine, gates, grades, measured ladder, ghost chips, strip and band rendering were written from scratch for this script.
🟦 LIMITATIONS
- Supertrend lags by construction, and requiring two cores to agree makes entries later still — fewer, later, more heavily filtered signals is the intended trade-off.
- The NEUTRAL state derives from lagging measures (ADX, flip counts), so the first signals of a new trend can still arrive grey or be suppressed.
- All statistics are direction-only measurements over a fixed horizon; ladder odds are level measurements (TPs credit on a wick touch, core-mode stops resolve only on a confirmed core flip) — no fees, slippage, sizing or equity math. They are not a strategy backtest, they differ per symbol and timeframe, and they do not predict future outcomes.
- Without volume data the volume filter and its split stay inactive, and certified Grade A (confirmation + volume) is out of reach — signals cap at Grade B on volume-less feeds. Sample sizes on higher timeframes are structurally small; expect greyed rows there.
- The same asset on two different venues can show opposite states. A Supertrend flip is a threshold event: when price sits within a fraction of a percent of the band, a normal inter-exchange spread of a few basis points decides whether it crosses, and once one venue flips its stop jumps to the other side of price, so two nearly identical charts diverge sharply. This is inherent to the calculation, not a data error — treat a signal as belonging to the feed it was measured on, and check the panel's sample sizes on the venue you actually trade.
🟦 DISCLAIMER
This is an educational analysis tool, not investment advice. Historical measurements, however carefully computed, do not predict future results. Trading involves substantial risk.
Script open-source
Dans l'esprit TradingView, le créateur de ce script l'a rendu open source afin que les traders puissent examiner et vérifier ses fonctionnalités. Bravo à l'auteur! Bien que vous puissiez l'utiliser gratuitement, n'oubliez pas que la republication du code est soumise à nos Règles.

Free guides. Know the odds before you trade. → machinesuite.ai
Clause de non-responsabilité
Les informations et publications ne sont pas destinées à être, et ne constituent pas, des conseils ou recommandations financiers, d'investissement, de trading ou autres fournis ou approuvés par TradingView. Pour en savoir plus, consultez les Conditions d'utilisation.
Script open-source
Dans l'esprit TradingView, le créateur de ce script l'a rendu open source afin que les traders puissent examiner et vérifier ses fonctionnalités. Bravo à l'auteur! Bien que vous puissiez l'utiliser gratuitement, n'oubliez pas que la republication du code est soumise à nos Règles.
Free guides. Know the odds before you trade. → machinesuite.ai
Clause de non-responsabilité
Les informations et publications ne sont pas destinées à être, et ne constituent pas, des conseils ou recommandations financiers, d'investissement, de trading ou autres fournis ou approuvés par TradingView. Pour en savoir plus, consultez les Conditions d'utilisation.