Mis à jour
[blackcat] L2 Improved Jeffrey Owen Cyclical System
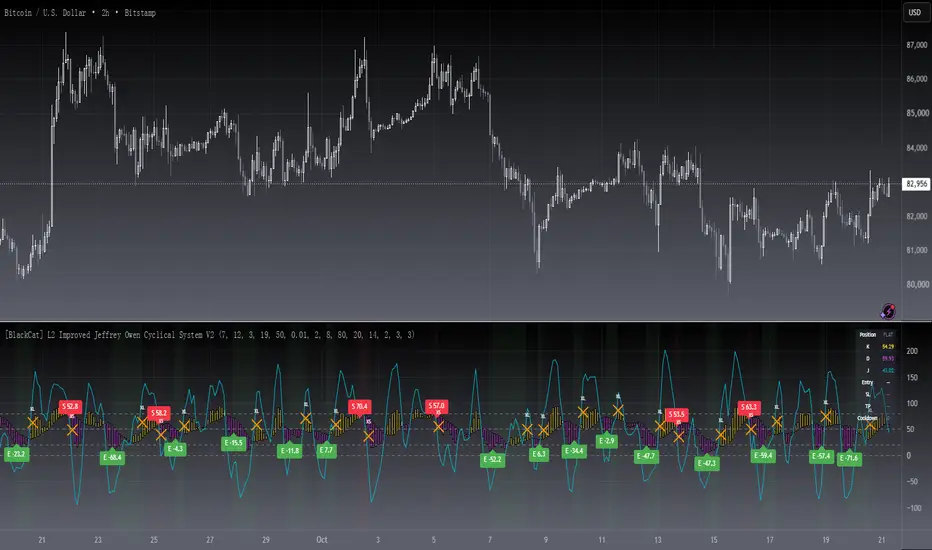
Level: 2
Background
In Jeffrey Owen Katz's article "Trading stocks with a cyclical system" he introduces the Stock Rhythm System. I found the central part is quite similar to KDJ indicator and I use my own KDJ algo to enhance its performance.
Function
Jeffrey Owen Katz has a customized stochastic indicator. I used it as the engine of my own KDJ trading system. My KDJ oscillator display consists of 3 lines (K, D and J - hence the name of the display) and 2 levels. K and D are the same lines you see when using the stochastic oscillator. The J line in turn represents the deviation of the D value from the K value. The convergence of these lines indicates new trading opportunities. Just like the Stochastic Oscillator, oversold and overbought levels correspond to the times when the trend is likely to reverse. Just as the Stochastic, the KDJ has the K & D lines, plus the J. This last one represents the divergence from the K-line. When all three converge, it usually signals a possible trend forming. Labels and alerts are added for long and short entries.
Key Signal
KVal --> K.
DVal --> D.
JVal --> J.
Remarks
This is a Level 2 free and open source indicator.
Feedbacks are appreciated.
Background
In Jeffrey Owen Katz's article "Trading stocks with a cyclical system" he introduces the Stock Rhythm System. I found the central part is quite similar to KDJ indicator and I use my own KDJ algo to enhance its performance.
Function
Jeffrey Owen Katz has a customized stochastic indicator. I used it as the engine of my own KDJ trading system. My KDJ oscillator display consists of 3 lines (K, D and J - hence the name of the display) and 2 levels. K and D are the same lines you see when using the stochastic oscillator. The J line in turn represents the deviation of the D value from the K value. The convergence of these lines indicates new trading opportunities. Just like the Stochastic Oscillator, oversold and overbought levels correspond to the times when the trend is likely to reverse. Just as the Stochastic, the KDJ has the K & D lines, plus the J. This last one represents the divergence from the K-line. When all three converge, it usually signals a possible trend forming. Labels and alerts are added for long and short entries.
Key Signal
KVal --> K.
DVal --> D.
JVal --> J.
Remarks
This is a Level 2 free and open source indicator.
Feedbacks are appreciated.
Notes de version
[B]OVERVIEW[/B]This advanced technical analysis indicator implements an enhanced version of Jeffrey Owen's cyclical system specifically adapted for Level 2 market data trading strategies. The script combines custom-stochastic calculations with unique entry-exit rules designed to capture optimal trade opportunities 📈📊.
The system employs multiple timeframes and dynamic filtering mechanisms to reduce false signals and improve overall reliability 🔍📉. It includes real-time alert notifications for both long and short positions, ensuring traders don't miss critical market movements ⏰🔔.
Key Features:
• Advanced stochastic oscillator implementation 🎯
• Multi-bar confirmation filters for increased accuracy ✅
• Real-time position labels on chart display 📝
• Comprehensive horizontal reference lines for visual guidance 💻
• Robust alert conditions for timely trade execution 🚀
HOW TO USE[/B]
Setup Parameters:
• Adjust K Periods, D Periods, and K Slow values based on preferred timeframe sensitivity
• Set Exit Bars according to your risk management strategy
Entry Analysis:
• Monitor crossover points between J value and recent historical levels
• Look for lowest J values confirmation combined with price action context
Risk Management:
• Utilize built-in alerts to track potential entries without constant screen monitoring
• Consider additional indicators for confirmation before executing trades
LIMITATIONS[/B]
⚠️ Please note that while this indicator has been optimized for performance, it should be used in conjunction with fundamental analysis and proper money management principles. No single indicator guarantees successful trading outcomes.
NOTES[/B]
This script was created by blackcat1402 under the Mozilla Public License 2.0 framework. For detailed documentation and updates, please refer to the original repository sources.
Notes de version
█ OVERVIEWThis indicator spots cyclical turning points with a slow-stochastic K/D/J engine: it buys panic washouts when the J line turns up from a double-window low, and shorts distribution when K crosses below D with momentum still elevated. V2 upgrades it into a complete, alert-ready cycle-trading toolkit with position tracking, explicit exits, and ATR-based risk levels.
█ CONCEPTS
The system is built on Jeffrey Owen's cyclical reading of the KDJ oscillator:
• Custom slow stochastic: K from a configurable lookback (K Periods / K Slow), D is its moving average, J = 3K - 2D amplifies momentum extremes beyond the 0-100 band
• Long - washout reversal: J prints a matching low over a short window and a longer base (double-low confirmation), turns up by a minimum margin, and sits deep in oversold (J < 19 by default)
• Short - distribution dead-cross: K crosses below D while J is still above its mid threshold, catching downside cycles that begin from strength
• Cycle exits: longs release at overbought J (80), shorts at oversold J (20); an opposite entry flips the position directly
█ HOW TO USE
1 — Add the script to any chart; it runs in a separate pane. Candles plot the K/D relationship (yellow when K ≥ D, fuchsia when D > K) with the J line in aqua
2 — Wait for a confirmed label: green "E" for longs, red "S" for shorts, orange "XL"/"XS" crosses for exits
3 — Set the four alerts (Long/Short Entry, Long/Short Exit) once — all fire on bar close only
4 — Use the dashboard (top right) for live state: position, K/D/J, entry price, ATR stop/target, cooldown left
Input Parameters (full reference in the instructions file)
• Stochastic Settings: K Periods (7), D Periods (12), K Slow (3) — oscillator construction
• Signal Settings: Long/Short J Threshold (19/50), J Turn Margin (0.01), double-low windows (2/8)
• Exit Settings: Long/Short Exit J Level (80/20), Exit On Opposite Signal (on) — flip on reverse entries
• Risk Management: ATR Length (14), Stop Loss xATR (2.0), Take Profit xATR (3.0)
• Signal Governance: Cooldown Bars (3, 0 = off), Same-bar Exclusivity (on)
• Visuals: toggles for labels, position background, dashboard
█ FEATURES
• Full cycle system: entries, exits, and direct position flips — not just raw crosses
• State machine with cooldown and same-bar arbitration: no signal spam, no contradictory states
• ATR-scaled stop/target references that adapt to each instrument's volatility
• Four alertcondition channels plus dynamic alert() messages with price and J value (bar close only)
• Dashboard, position tint, and K/D/J readouts for at-a-glance monitoring
• Every threshold is an input — tune the cycle engine for any market or timeframe
█ SIGNALS
• Green "E": long entry — J turn-up from a double-window low in oversold
• Red "S": short entry — K/D dead-cross with J above mid threshold
• Orange "XL"/"XS": long/short exit — J overbought/oversold, or position flipped
• Pane tint green/red: current long/short state; reference lines at 0/20/50/80
█ IMPLEMENTATION NOTES
• K uses ta.lowest/ta.highest with an optional ta.sma slow pass; D smooths K; all series are na-protected during warm-up
• Signal predicates are single-shot edges, so a fresh cross fires exactly once; ta.atr(14) anchors risk levels (dashboard + data window)
• No request.security — chart-timeframe data only, no repainting: alerts use bar-close confirmation and max_labels_count = 500 bounds label history
█ LIMITATIONS
• Oscillator cycle systems excel in ranging and mean-reverting markets; strong one-way trends can keep J pinned and delay or suppress signals
• The 80/20 cycle exits give back open profit in extended trends — consider the ATR take-profit as the disciplined target
• Very low timeframes (below 5m) amplify noise; cooldown default suits 15m and higher
• Not financial advice — forward-test on your symbol and timeframe first
█ NOTES
• Original concept © blackcat1402 (Mozilla Public License 2.0); V2 polish adds governance, exits, risk levels, and visualization
• Inspired by Jeffrey Owen's cyclical reading of the KDJ oscillator (George Lane's stochastic lineage)
═════════════════════════════════════════════════════════════════════════
For questions or feedback, use the comments section below.
Feel free to use and modify — attribution appreciated.

Don't miss out! The first and most important thing to do is to join my Discord chat now! Click here to start your adventure: discord.com/invite/ZTGpQJq My new github for more pine development soon: github.com/wxt-coder
Clause de non-responsabilité
Les informations et publications ne sont pas destinées à être, et ne constituent pas, des conseils ou recommandations financiers, d'investissement, de trading ou autres fournis ou approuvés par TradingView. Pour en savoir plus, consultez les Conditions d'utilisation.
Don't miss out! The first and most important thing to do is to join my Discord chat now! Click here to start your adventure: discord.com/invite/ZTGpQJq My new github for more pine development soon: github.com/wxt-coder
Clause de non-responsabilité
Les informations et publications ne sont pas destinées à être, et ne constituent pas, des conseils ou recommandations financiers, d'investissement, de trading ou autres fournis ou approuvés par TradingView. Pour en savoir plus, consultez les Conditions d'utilisation.