Market Phase Detector v2.3 [Wyckoff MTF]
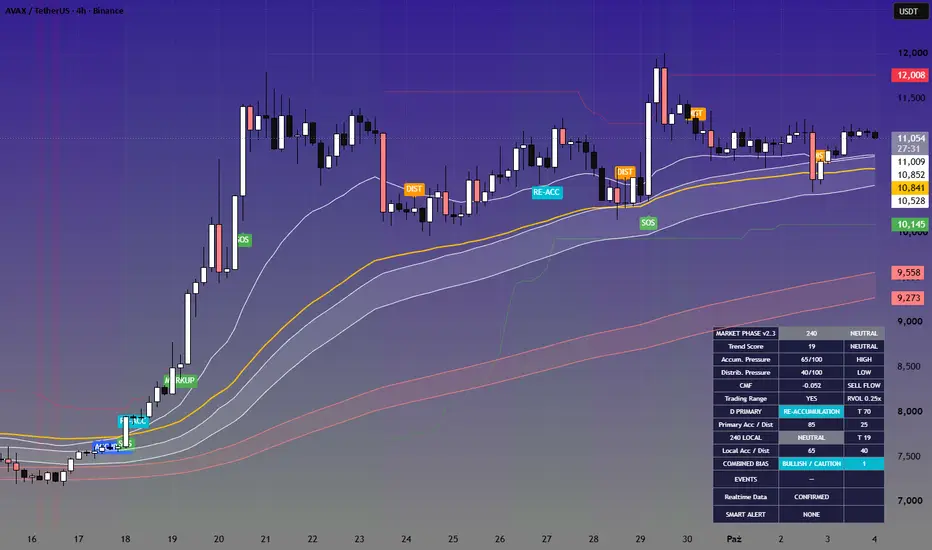
MARKET PHASE DETECTOR v2.3 [WYCKOFF MTF]
OVERVIEW
Market Phase Detector v2.3 is a multi-timeframe market structure and Wyckoff-style phase detection indicator designed to help identify:
• Accumulation
• Re-Accumulation
• Markup
• Distribution
• Re-Distribution
• Markdown
• Neutral market conditions
The indicator combines trend structure, EMA relationships, ATR-normalized momentum, money flow, relative volume, range behavior, liquidity sweeps, and multi-timeframe context.
Its main purpose is to help answer a simple question:
What phase is the market currently in, and is the higher-timeframe trend aligned with the local structure?
This indicator is designed as a market context and confirmation tool, not as a standalone buy/sell system.
━━━━━━━━━━━━━━━━━━
MARKET PHASES
━━━━━━━━━━━━━━━━━━
ACCUMULATION
A range-like environment where buying pressure begins to dominate after a weaker or bearish period.
Typical characteristics may include:
• Sideways market structure
• Improving money flow
• Rising OBV / A-D behavior
• Buying volume dominance
• Possible Spring event
• Improving local structure
Accumulation may represent a base-building phase before a potential bullish transition.
RE-ACCUMULATION
A consolidation phase that occurs while the broader trend remains bullish.
Unlike classical Accumulation, Re-Accumulation appears inside an already positive market structure.
Typical interpretation:
The market is pausing or consolidating while the broader bullish trend remains intact.
This phase may help identify continuation conditions after an earlier Markup phase.
MARKUP
A directional bullish trend.
Typical characteristics:
• Positive Trend Score
• Price above trend averages
• Rising EMA structure
• Positive momentum
• Improving market structure
Markup represents an established bullish environment rather than a base-building phase.
DISTRIBUTION
A sideways or topping environment where selling pressure becomes dominant.
Typical characteristics may include:
• Negative CMF
• Weakening OBV / A-D
• Selling volume dominance
• Structural deterioration
• Possible UTAD
• Weakening support
Distribution should be treated as a warning condition rather than an automatic sell signal.
RE-DISTRIBUTION
A consolidation phase inside a broader bearish trend.
Typical interpretation:
The market is pausing, but the broader structure remains bearish and may later continue lower.
MARKDOWN
A directional bearish trend.
Typical characteristics:
• Negative Trend Score
• Bearish EMA structure
• Negative momentum
• Falling market structure
• Sustained selling pressure
NEUTRAL
No sufficiently strong phase or directional advantage is detected.
Neutral conditions may appear during transitions, mixed environments, or when accumulation and distribution pressure remain relatively balanced.
━━━━━━━━━━━━━━━━━━
TREND SCORE
━━━━━━━━━━━━━━━━━━
The indicator calculates a Trend Score from -100 to +100.
The score combines:
• Price distance from the fast EMA
• Fast EMA vs slow EMA relationship
• EMA slope
• Momentum
• Market structure
• ATR-normalized movement
General interpretation:
+60 to +100 = Strong Bull
+25 to +59 = Bull
-24 to +24 = Neutral
-25 to -59 = Bear
-60 to -100 = Strong Bear
The Trend Score is also used internally to distinguish:
• Accumulation from Re-Accumulation
• Distribution from Re-Distribution
• Consolidation from directional trend phases
━━━━━━━━━━━━━━━━━━
ACCUMULATION PRESSURE
━━━━━━━━━━━━━━━━━━
Accumulation Pressure is measured on a 0–100 scale.
It considers factors such as:
• Sideways market behavior
• Positive CMF
• Rising OBV
• Rising A-D
• Buying volume dominance
• Recent downside liquidity sweep
• Confirmed Spring
• Bullish structural recovery
General interpretation:
0–49 = Low
50–64 = Medium
65–79 = High
80–100 = Very High
A high Accumulation Pressure score does not automatically mean that the market is in Accumulation.
The final market phase also depends on trend context and competing Distribution Pressure.
━━━━━━━━━━━━━━━━━━
DISTRIBUTION PRESSURE
━━━━━━━━━━━━━━━━━━
Distribution Pressure is also measured on a 0–100 scale.
It considers:
• Sideways market behavior
• Negative CMF
• Falling OBV
• Falling A-D
• Selling volume dominance
• Recent upside liquidity sweep
• Confirmed UTAD
• Bearish structural damage
General interpretation:
0–49 = Low
50–64 = Medium
65–79 = High
80–100 = Very High
A high Distribution Pressure score warns that selling pressure is increasing.
However, the indicator also checks the broader trend before classifying the market as full Distribution.
This helps reduce false Distribution signals during ordinary pullbacks inside strong bullish trends.
━━━━━━━━━━━━━━━━━━
MONEY FLOW
━━━━━━━━━━━━━━━━━━
The indicator uses Chaikin Money Flow (CMF) as one of its flow measurements.
General interpretation:
CMF > 0 = Positive / Buy Flow
CMF < 0 = Negative / Sell Flow
The indicator also uses:
• OBV slope
• Accumulation / Distribution slope
• Directional volume dominance
This allows the script to evaluate more than price direction alone.
━━━━━━━━━━━━━━━━━━
RELATIVE VOLUME
━━━━━━━━━━━━━━━━━━
RVOL shows Relative Volume compared with its average.
Examples:
0.50x = 50% of average volume
1.00x = average volume
1.50x = 50% above average
2.00x = twice the average volume
RVOL is especially important for confirming:
• SOS
• SOW
• Breakout quality
When confirmed-bar mode is enabled, the indicator uses confirmed data rather than incomplete realtime volume.
━━━━━━━━━━━━━━━━━━
TRADING RANGE DETECTION
━━━━━━━━━━━━━━━━━━
The script uses market efficiency to determine whether price is operating inside a trading range.
When:
Trading Range = YES
the script focuses more heavily on identifying:
• Accumulation
• Re-Accumulation
• Distribution
• Re-Distribution
• Spring
• UTAD
When:
Trading Range = NO
the market is more likely to be treated as directional:
• Markup
• Markdown
• Neutral transition
━━━━━━━━━━━━━━━━━━
WYCKOFF-STYLE EVENTS
━━━━━━━━━━━━━━━━━━
SPRING
A Spring occurs when price moves below a previous range low and then recovers back into the range.
The indicator requires additional confirmation before labeling a Spring.
A confirmed Spring typically requires:
• Recent downside sweep
• Range conditions
• Recovery above the range midpoint
• Positive CMF
• Rising OBV
A Spring may indicate that downside liquidity was taken before a potential bullish recovery.
UTAD
UTAD stands for Upthrust After Distribution.
It is the bearish counterpart to a Spring.
The indicator looks for:
• Upside liquidity sweep
• Return below the range structure
• Negative CMF
• Falling OBV
• Bearish structural damage
UTAD may indicate that an upside breakout failed and selling pressure is increasing.
SOS — SIGN OF STRENGTH
SOS identifies a bullish breakout from the range with stronger relative volume and positive flow.
Typical interpretation:
Buyers are taking control and the market may be transitioning from Accumulation or Re-Accumulation into Markup.
SOW — SIGN OF WEAKNESS
SOW identifies a bearish break below the range with elevated relative volume and negative flow.
Typical interpretation:
Sellers are taking control and the market may be transitioning from Distribution or Re-Distribution into Markdown.
━━━━━━━━━━━━━━━━━━
MULTI-TIMEFRAME ANALYSIS
━━━━━━━━━━━━━━━━━━
One of the main features of v2.3 is its multi-timeframe framework.
Default settings:
Primary Timeframe = 1D
Local Timeframe = 4H
The Primary timeframe defines the broader market context.
The Local timeframe is used to identify shorter-term structure and confirmation.
Example:
1D = Re-Accumulation
4H = Distribution
This does not automatically mean that the entire market is bearish.
It may instead indicate:
Bullish higher-timeframe structure with local weakness, profit-taking, or corrective price action.
━━━━━━━━━━━━━━━━━━
COMBINED BIAS
━━━━━━━━━━━━━━━━━━
The indicator combines the Primary and Local timeframe conditions into a Combined Bias.
Possible outputs:
BULLISH
Higher and lower timeframes are broadly aligned to the upside.
BULLISH / CAUTION
The Primary structure remains bullish, but the Local timeframe is showing weakness or Distribution.
NEUTRAL
No strong directional alignment.
BEARISH / CAUTION
The Primary structure remains bearish while the Local timeframe shows temporary bullish recovery.
BEARISH
Both timeframes are broadly aligned to the downside.
━━━━━━━━━━━━━━━━━━
SMART MTF ALERTS
━━━━━━━━━━━━━━━━━━
Version 2.3 includes context-aware alerts based on the interaction between the Primary and Local timeframe.
MTF STRONG BULLISH SETUP
Triggered when:
• Higher-timeframe context remains strongly bullish
• Local timeframe confirms strength
• Distribution Pressure remains controlled
This may include:
• Primary Markup
• Primary Re-Accumulation
• Local Markup
• Local Re-Accumulation
• Local SOS
This alert is designed to identify bullish continuation conditions.
MTF BULLISH RECOVERY
Triggered when:
• Higher-timeframe structure remains bullish
• Local timeframe previously showed weakness
• Local strength returns through an SOS condition
This may help identify recovery after a local correction.
MTF RISK WARNING
Triggered when:
• Higher-timeframe structure remains bullish
• Local timeframe enters Distribution
• Distribution Pressure reaches a meaningful level
This is an early caution signal.
It does not necessarily mean that the entire trend has reversed.
MTF BEARISH REVERSAL WARNING
A stronger bearish warning.
It requires:
• Weakening higher-timeframe structure
• Strong local Distribution
• Local SOW confirmation
This is designed to identify conditions where local weakness may be developing into a broader bearish transition.
━━━━━━━━━━━━━━━━━━
ALERT CONDITIONS
━━━━━━━━━━━━━━━━━━
The script includes alert conditions for:
• Accumulation
• Re-Accumulation
• Markup
• Distribution
• Re-Distribution
• Markdown
• Confirmed Spring
• Confirmed UTAD
• SOS
• SOW
• MTF Strong Bullish Setup
• MTF Bullish Recovery
• MTF Risk Warning
• MTF Bearish Reversal Warning
For confirmed signals, using:
Once Per Bar Close
is recommended.
━━━━━━━━━━━━━━━━━━
SUGGESTED WORKFLOW
━━━━━━━━━━━━━━━━━━
A practical way to read the indicator is:
1. Combined Bias
2. Primary market phase
3. Local market phase
4. Trend Score
5. Accumulation / Distribution Pressure
6. CMF and RVOL
7. Spring / UTAD / SOS / SOW
The indicator is designed around context.
A single label or signal should generally not be used in isolation.
Example of a stronger bullish condition:
Primary: Re-Accumulation
Local: Markup
Trend Score: Positive
Accumulation Pressure: High
CMF: Positive
Combined Bias: Bullish
Smart Alert: Strong Bullish
━━━━━━━━━━━━━━━━━━
RECOMMENDED TIMEFRAMES
━━━━━━━━━━━━━━━━━━
The indicator was designed primarily for:
1D = broader market phase
4H = local structure and confirmation
Lower timeframes can also be used, but market noise increases significantly.
The default MTF combination is:
Primary = 1D
Local = 4H
━━━━━━━━━━━━━━━━━━
IMPORTANT NOTES
━━━━━━━━━━━━━━━━━━
This indicator does not attempt to predict exact market tops or bottoms.
It is designed to:
• Classify market regime
• Identify market phase
• Measure Accumulation and Distribution Pressure
• Provide trend context
• Detect Wyckoff-style events
• Combine multiple timeframes
• Generate contextual alerts
It should be treated as an analytical and confirmation tool rather than a mechanical trading system.
Market conditions can change rapidly, and no indicator can reliably identify every reversal or continuation.
━━━━━━━━━━━━━━━━━━
DISCLAIMER
━━━━━━━━━━━━━━━━━━
This script is intended for educational and analytical purposes only.
It does not constitute financial advice, investment advice, trading advice, or a recommendation to buy or sell any asset.
Signals generated by the indicator should be used together with independent analysis, risk management, and appropriate position sizing.
Past market behavior does not guarantee future results.
OVERVIEW
Market Phase Detector v2.3 is a multi-timeframe market structure and Wyckoff-style phase detection indicator designed to help identify:
• Accumulation
• Re-Accumulation
• Markup
• Distribution
• Re-Distribution
• Markdown
• Neutral market conditions
The indicator combines trend structure, EMA relationships, ATR-normalized momentum, money flow, relative volume, range behavior, liquidity sweeps, and multi-timeframe context.
Its main purpose is to help answer a simple question:
What phase is the market currently in, and is the higher-timeframe trend aligned with the local structure?
This indicator is designed as a market context and confirmation tool, not as a standalone buy/sell system.
━━━━━━━━━━━━━━━━━━
MARKET PHASES
━━━━━━━━━━━━━━━━━━
ACCUMULATION
A range-like environment where buying pressure begins to dominate after a weaker or bearish period.
Typical characteristics may include:
• Sideways market structure
• Improving money flow
• Rising OBV / A-D behavior
• Buying volume dominance
• Possible Spring event
• Improving local structure
Accumulation may represent a base-building phase before a potential bullish transition.
RE-ACCUMULATION
A consolidation phase that occurs while the broader trend remains bullish.
Unlike classical Accumulation, Re-Accumulation appears inside an already positive market structure.
Typical interpretation:
The market is pausing or consolidating while the broader bullish trend remains intact.
This phase may help identify continuation conditions after an earlier Markup phase.
MARKUP
A directional bullish trend.
Typical characteristics:
• Positive Trend Score
• Price above trend averages
• Rising EMA structure
• Positive momentum
• Improving market structure
Markup represents an established bullish environment rather than a base-building phase.
DISTRIBUTION
A sideways or topping environment where selling pressure becomes dominant.
Typical characteristics may include:
• Negative CMF
• Weakening OBV / A-D
• Selling volume dominance
• Structural deterioration
• Possible UTAD
• Weakening support
Distribution should be treated as a warning condition rather than an automatic sell signal.
RE-DISTRIBUTION
A consolidation phase inside a broader bearish trend.
Typical interpretation:
The market is pausing, but the broader structure remains bearish and may later continue lower.
MARKDOWN
A directional bearish trend.
Typical characteristics:
• Negative Trend Score
• Bearish EMA structure
• Negative momentum
• Falling market structure
• Sustained selling pressure
NEUTRAL
No sufficiently strong phase or directional advantage is detected.
Neutral conditions may appear during transitions, mixed environments, or when accumulation and distribution pressure remain relatively balanced.
━━━━━━━━━━━━━━━━━━
TREND SCORE
━━━━━━━━━━━━━━━━━━
The indicator calculates a Trend Score from -100 to +100.
The score combines:
• Price distance from the fast EMA
• Fast EMA vs slow EMA relationship
• EMA slope
• Momentum
• Market structure
• ATR-normalized movement
General interpretation:
+60 to +100 = Strong Bull
+25 to +59 = Bull
-24 to +24 = Neutral
-25 to -59 = Bear
-60 to -100 = Strong Bear
The Trend Score is also used internally to distinguish:
• Accumulation from Re-Accumulation
• Distribution from Re-Distribution
• Consolidation from directional trend phases
━━━━━━━━━━━━━━━━━━
ACCUMULATION PRESSURE
━━━━━━━━━━━━━━━━━━
Accumulation Pressure is measured on a 0–100 scale.
It considers factors such as:
• Sideways market behavior
• Positive CMF
• Rising OBV
• Rising A-D
• Buying volume dominance
• Recent downside liquidity sweep
• Confirmed Spring
• Bullish structural recovery
General interpretation:
0–49 = Low
50–64 = Medium
65–79 = High
80–100 = Very High
A high Accumulation Pressure score does not automatically mean that the market is in Accumulation.
The final market phase also depends on trend context and competing Distribution Pressure.
━━━━━━━━━━━━━━━━━━
DISTRIBUTION PRESSURE
━━━━━━━━━━━━━━━━━━
Distribution Pressure is also measured on a 0–100 scale.
It considers:
• Sideways market behavior
• Negative CMF
• Falling OBV
• Falling A-D
• Selling volume dominance
• Recent upside liquidity sweep
• Confirmed UTAD
• Bearish structural damage
General interpretation:
0–49 = Low
50–64 = Medium
65–79 = High
80–100 = Very High
A high Distribution Pressure score warns that selling pressure is increasing.
However, the indicator also checks the broader trend before classifying the market as full Distribution.
This helps reduce false Distribution signals during ordinary pullbacks inside strong bullish trends.
━━━━━━━━━━━━━━━━━━
MONEY FLOW
━━━━━━━━━━━━━━━━━━
The indicator uses Chaikin Money Flow (CMF) as one of its flow measurements.
General interpretation:
CMF > 0 = Positive / Buy Flow
CMF < 0 = Negative / Sell Flow
The indicator also uses:
• OBV slope
• Accumulation / Distribution slope
• Directional volume dominance
This allows the script to evaluate more than price direction alone.
━━━━━━━━━━━━━━━━━━
RELATIVE VOLUME
━━━━━━━━━━━━━━━━━━
RVOL shows Relative Volume compared with its average.
Examples:
0.50x = 50% of average volume
1.00x = average volume
1.50x = 50% above average
2.00x = twice the average volume
RVOL is especially important for confirming:
• SOS
• SOW
• Breakout quality
When confirmed-bar mode is enabled, the indicator uses confirmed data rather than incomplete realtime volume.
━━━━━━━━━━━━━━━━━━
TRADING RANGE DETECTION
━━━━━━━━━━━━━━━━━━
The script uses market efficiency to determine whether price is operating inside a trading range.
When:
Trading Range = YES
the script focuses more heavily on identifying:
• Accumulation
• Re-Accumulation
• Distribution
• Re-Distribution
• Spring
• UTAD
When:
Trading Range = NO
the market is more likely to be treated as directional:
• Markup
• Markdown
• Neutral transition
━━━━━━━━━━━━━━━━━━
WYCKOFF-STYLE EVENTS
━━━━━━━━━━━━━━━━━━
SPRING
A Spring occurs when price moves below a previous range low and then recovers back into the range.
The indicator requires additional confirmation before labeling a Spring.
A confirmed Spring typically requires:
• Recent downside sweep
• Range conditions
• Recovery above the range midpoint
• Positive CMF
• Rising OBV
A Spring may indicate that downside liquidity was taken before a potential bullish recovery.
UTAD
UTAD stands for Upthrust After Distribution.
It is the bearish counterpart to a Spring.
The indicator looks for:
• Upside liquidity sweep
• Return below the range structure
• Negative CMF
• Falling OBV
• Bearish structural damage
UTAD may indicate that an upside breakout failed and selling pressure is increasing.
SOS — SIGN OF STRENGTH
SOS identifies a bullish breakout from the range with stronger relative volume and positive flow.
Typical interpretation:
Buyers are taking control and the market may be transitioning from Accumulation or Re-Accumulation into Markup.
SOW — SIGN OF WEAKNESS
SOW identifies a bearish break below the range with elevated relative volume and negative flow.
Typical interpretation:
Sellers are taking control and the market may be transitioning from Distribution or Re-Distribution into Markdown.
━━━━━━━━━━━━━━━━━━
MULTI-TIMEFRAME ANALYSIS
━━━━━━━━━━━━━━━━━━
One of the main features of v2.3 is its multi-timeframe framework.
Default settings:
Primary Timeframe = 1D
Local Timeframe = 4H
The Primary timeframe defines the broader market context.
The Local timeframe is used to identify shorter-term structure and confirmation.
Example:
1D = Re-Accumulation
4H = Distribution
This does not automatically mean that the entire market is bearish.
It may instead indicate:
Bullish higher-timeframe structure with local weakness, profit-taking, or corrective price action.
━━━━━━━━━━━━━━━━━━
COMBINED BIAS
━━━━━━━━━━━━━━━━━━
The indicator combines the Primary and Local timeframe conditions into a Combined Bias.
Possible outputs:
BULLISH
Higher and lower timeframes are broadly aligned to the upside.
BULLISH / CAUTION
The Primary structure remains bullish, but the Local timeframe is showing weakness or Distribution.
NEUTRAL
No strong directional alignment.
BEARISH / CAUTION
The Primary structure remains bearish while the Local timeframe shows temporary bullish recovery.
BEARISH
Both timeframes are broadly aligned to the downside.
━━━━━━━━━━━━━━━━━━
SMART MTF ALERTS
━━━━━━━━━━━━━━━━━━
Version 2.3 includes context-aware alerts based on the interaction between the Primary and Local timeframe.
MTF STRONG BULLISH SETUP
Triggered when:
• Higher-timeframe context remains strongly bullish
• Local timeframe confirms strength
• Distribution Pressure remains controlled
This may include:
• Primary Markup
• Primary Re-Accumulation
• Local Markup
• Local Re-Accumulation
• Local SOS
This alert is designed to identify bullish continuation conditions.
MTF BULLISH RECOVERY
Triggered when:
• Higher-timeframe structure remains bullish
• Local timeframe previously showed weakness
• Local strength returns through an SOS condition
This may help identify recovery after a local correction.
MTF RISK WARNING
Triggered when:
• Higher-timeframe structure remains bullish
• Local timeframe enters Distribution
• Distribution Pressure reaches a meaningful level
This is an early caution signal.
It does not necessarily mean that the entire trend has reversed.
MTF BEARISH REVERSAL WARNING
A stronger bearish warning.
It requires:
• Weakening higher-timeframe structure
• Strong local Distribution
• Local SOW confirmation
This is designed to identify conditions where local weakness may be developing into a broader bearish transition.
━━━━━━━━━━━━━━━━━━
ALERT CONDITIONS
━━━━━━━━━━━━━━━━━━
The script includes alert conditions for:
• Accumulation
• Re-Accumulation
• Markup
• Distribution
• Re-Distribution
• Markdown
• Confirmed Spring
• Confirmed UTAD
• SOS
• SOW
• MTF Strong Bullish Setup
• MTF Bullish Recovery
• MTF Risk Warning
• MTF Bearish Reversal Warning
For confirmed signals, using:
Once Per Bar Close
is recommended.
━━━━━━━━━━━━━━━━━━
SUGGESTED WORKFLOW
━━━━━━━━━━━━━━━━━━
A practical way to read the indicator is:
1. Combined Bias
2. Primary market phase
3. Local market phase
4. Trend Score
5. Accumulation / Distribution Pressure
6. CMF and RVOL
7. Spring / UTAD / SOS / SOW
The indicator is designed around context.
A single label or signal should generally not be used in isolation.
Example of a stronger bullish condition:
Primary: Re-Accumulation
Local: Markup
Trend Score: Positive
Accumulation Pressure: High
CMF: Positive
Combined Bias: Bullish
Smart Alert: Strong Bullish
━━━━━━━━━━━━━━━━━━
RECOMMENDED TIMEFRAMES
━━━━━━━━━━━━━━━━━━
The indicator was designed primarily for:
1D = broader market phase
4H = local structure and confirmation
Lower timeframes can also be used, but market noise increases significantly.
The default MTF combination is:
Primary = 1D
Local = 4H
━━━━━━━━━━━━━━━━━━
IMPORTANT NOTES
━━━━━━━━━━━━━━━━━━
This indicator does not attempt to predict exact market tops or bottoms.
It is designed to:
• Classify market regime
• Identify market phase
• Measure Accumulation and Distribution Pressure
• Provide trend context
• Detect Wyckoff-style events
• Combine multiple timeframes
• Generate contextual alerts
It should be treated as an analytical and confirmation tool rather than a mechanical trading system.
Market conditions can change rapidly, and no indicator can reliably identify every reversal or continuation.
━━━━━━━━━━━━━━━━━━
DISCLAIMER
━━━━━━━━━━━━━━━━━━
This script is intended for educational and analytical purposes only.
It does not constitute financial advice, investment advice, trading advice, or a recommendation to buy or sell any asset.
Signals generated by the indicator should be used together with independent analysis, risk management, and appropriate position sizing.
Past market behavior does not guarantee future results.

Clause de non-responsabilité
Les informations et publications ne sont pas destinées à être, et ne constituent pas, des conseils ou recommandations financiers, d'investissement, de trading ou autres fournis ou approuvés par TradingView. Pour en savoir plus, consultez les Conditions d'utilisation.
Clause de non-responsabilité
Les informations et publications ne sont pas destinées à être, et ne constituent pas, des conseils ou recommandations financiers, d'investissement, de trading ou autres fournis ou approuvés par TradingView. Pour en savoir plus, consultez les Conditions d'utilisation.