Consecutive Trend Counter [Achira Meegasthanne]
Consecutive Trend Counter
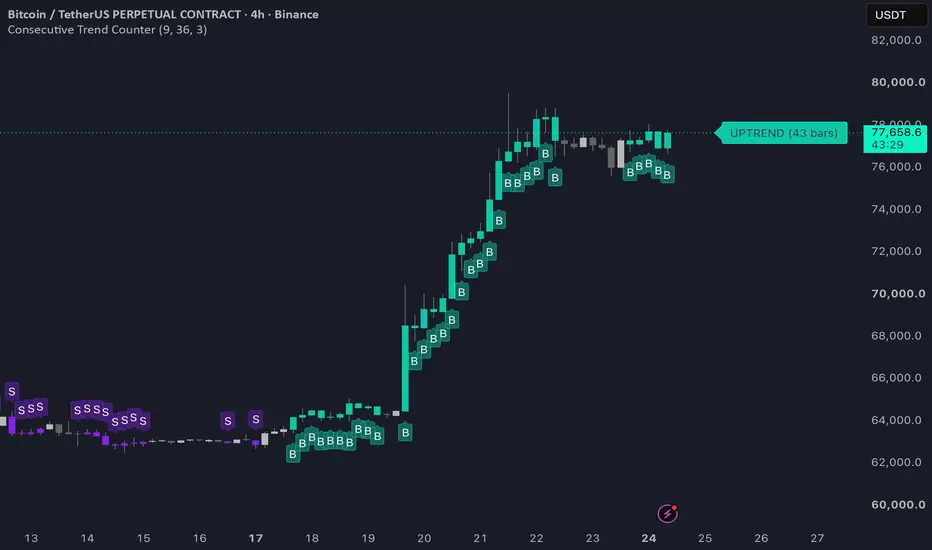
Consecutive Trend Counter is a multi-timeframe trend analysis indicator designed to identify and visualize sustained bullish and bearish market conditions.
The indicator compares a Fast EMA with a Slow WMA and counts how many consecutive bars the current trend has remained bullish or bearish.
It then combines trend conditions from multiple timeframes to identify stronger directional alignment.
🔹 KEY FEATURES
📈 Consecutive Trend Counter
The indicator tracks the number of consecutive bars where:
• Fast EMA > Slow WMA = Bullish
• Fast EMA < Slow WMA = Bearish
When the direction changes, the previous counter is reset and the new trend count begins.
⏱️ MULTI-TIMEFRAME TREND ANALYSIS
The indicator checks trend direction across three timeframes:
• Current Chart Timeframe
• 60-Minute Timeframe
• 240-Minute Timeframe
This allows the indicator to identify when multiple timeframes are aligned in the same direction.
🟢 UPTREND CONFIRMATION
An UPTREND condition is displayed when:
• Current timeframe is bullish
• 60-minute trend is bullish
• 240-minute trend is bullish
• Bullish consecutive count reaches the selected threshold
The indicator displays the number of consecutive bullish bars directly on the chart.
🔴 DOWNTREND CONFIRMATION
A DOWNTREND condition is displayed when:
• Current timeframe is bearish
• 60-minute trend is bearish
• 240-minute trend is bearish
• Bearish consecutive count reaches the selected threshold
The indicator displays the number of consecutive bearish bars directly on the chart.
💪 TREND STRENGTH
The indicator identifies stronger trends when the consecutive trend count reaches 30 bars or more.
Strong bullish and bearish conditions receive a stronger visual indication on the chart.
↔️ SIDEWAYS MARKET DETECTION
When all timeframes are not aligned, the indicator can classify the market as:
• SIDEWAYS
• SIDEWAYS UP
• SIDEWAYS BEAR
This helps distinguish between strong directional conditions and periods where the market lacks complete multi-timeframe alignment.
⚙️ CUSTOMIZABLE SETTINGS
The indicator provides several user-controlled settings:
• Up Color
• Down Color
• Plot Moving Averages
• Fast Moving Average Length
• Slow Moving Average Length
• Trend Threshold
The default Fast Moving Average is 9 EMA and the default Slow Moving Average is 36 WMA.
📊 MOVING AVERAGE VISUALIZATION
You can optionally display the Fast EMA and Slow WMA directly on the chart.
This makes it easier to visually understand how the trend counter determines bullish and bearish conditions.
🎯 SIGNAL VISUALIZATION
When all monitored timeframes are aligned:
• Bullish conditions are highlighted with bullish bar coloring
• Bearish conditions are highlighted with bearish bar coloring
• Bullish markers are displayed below the bar
• Bearish markers are displayed above the bar
This provides a quick visual way to identify periods of stronger directional alignment.
🧠 HOW IT WORKS
1. Calculate Moving Averages
The indicator calculates a Fast EMA and Slow WMA.
2. Determine Trend Direction
Fast EMA above Slow WMA indicates bullish conditions.
Fast EMA below Slow WMA indicates bearish conditions.
3. Count Consecutive Bars
The indicator counts how many consecutive bars remain in the current direction.
4. Check Multiple Timeframes
The same trend relationship is evaluated on the current chart timeframe, 60-minute timeframe, and 240-minute timeframe.
5. Confirm Alignment
When all monitored timeframes agree and the consecutive count reaches the selected threshold, the indicator identifies a stronger trend condition.
6. Classify Market Condition
If the timeframes are not fully aligned, the indicator can display a sideways condition instead.
📌 TREND LOGIC
Bullish:
Fast EMA > Slow WMA
Bearish:
Fast EMA < Slow WMA
Strong Bullish:
Bullish consecutive count ≥ 30 bars
Strong Bearish:
Bearish consecutive count ≥ 30 bars
⚠️ IMPORTANT DISCLAIMER
This indicator is designed for market analysis and educational purposes.
Trend alignment and consecutive-bar counts should not be considered guaranteed buy or sell signals.
Market conditions can change quickly, and trend indicators may react after price movement has already occurred.
Always perform your own analysis, apply proper risk management, and test the indicator thoroughly before using it with real capital.
Track the trend. Measure its persistence. Confirm the direction.
Consecutive Trend Counter is a multi-timeframe trend analysis indicator designed to identify and visualize sustained bullish and bearish market conditions.
The indicator compares a Fast EMA with a Slow WMA and counts how many consecutive bars the current trend has remained bullish or bearish.
It then combines trend conditions from multiple timeframes to identify stronger directional alignment.
🔹 KEY FEATURES
📈 Consecutive Trend Counter
The indicator tracks the number of consecutive bars where:
• Fast EMA > Slow WMA = Bullish
• Fast EMA < Slow WMA = Bearish
When the direction changes, the previous counter is reset and the new trend count begins.
⏱️ MULTI-TIMEFRAME TREND ANALYSIS
The indicator checks trend direction across three timeframes:
• Current Chart Timeframe
• 60-Minute Timeframe
• 240-Minute Timeframe
This allows the indicator to identify when multiple timeframes are aligned in the same direction.
🟢 UPTREND CONFIRMATION
An UPTREND condition is displayed when:
• Current timeframe is bullish
• 60-minute trend is bullish
• 240-minute trend is bullish
• Bullish consecutive count reaches the selected threshold
The indicator displays the number of consecutive bullish bars directly on the chart.
🔴 DOWNTREND CONFIRMATION
A DOWNTREND condition is displayed when:
• Current timeframe is bearish
• 60-minute trend is bearish
• 240-minute trend is bearish
• Bearish consecutive count reaches the selected threshold
The indicator displays the number of consecutive bearish bars directly on the chart.
💪 TREND STRENGTH
The indicator identifies stronger trends when the consecutive trend count reaches 30 bars or more.
Strong bullish and bearish conditions receive a stronger visual indication on the chart.
↔️ SIDEWAYS MARKET DETECTION
When all timeframes are not aligned, the indicator can classify the market as:
• SIDEWAYS
• SIDEWAYS UP
• SIDEWAYS BEAR
This helps distinguish between strong directional conditions and periods where the market lacks complete multi-timeframe alignment.
⚙️ CUSTOMIZABLE SETTINGS
The indicator provides several user-controlled settings:
• Up Color
• Down Color
• Plot Moving Averages
• Fast Moving Average Length
• Slow Moving Average Length
• Trend Threshold
The default Fast Moving Average is 9 EMA and the default Slow Moving Average is 36 WMA.
📊 MOVING AVERAGE VISUALIZATION
You can optionally display the Fast EMA and Slow WMA directly on the chart.
This makes it easier to visually understand how the trend counter determines bullish and bearish conditions.
🎯 SIGNAL VISUALIZATION
When all monitored timeframes are aligned:
• Bullish conditions are highlighted with bullish bar coloring
• Bearish conditions are highlighted with bearish bar coloring
• Bullish markers are displayed below the bar
• Bearish markers are displayed above the bar
This provides a quick visual way to identify periods of stronger directional alignment.
🧠 HOW IT WORKS
1. Calculate Moving Averages
The indicator calculates a Fast EMA and Slow WMA.
2. Determine Trend Direction
Fast EMA above Slow WMA indicates bullish conditions.
Fast EMA below Slow WMA indicates bearish conditions.
3. Count Consecutive Bars
The indicator counts how many consecutive bars remain in the current direction.
4. Check Multiple Timeframes
The same trend relationship is evaluated on the current chart timeframe, 60-minute timeframe, and 240-minute timeframe.
5. Confirm Alignment
When all monitored timeframes agree and the consecutive count reaches the selected threshold, the indicator identifies a stronger trend condition.
6. Classify Market Condition
If the timeframes are not fully aligned, the indicator can display a sideways condition instead.
📌 TREND LOGIC
Bullish:
Fast EMA > Slow WMA
Bearish:
Fast EMA < Slow WMA
Strong Bullish:
Bullish consecutive count ≥ 30 bars
Strong Bearish:
Bearish consecutive count ≥ 30 bars
⚠️ IMPORTANT DISCLAIMER
This indicator is designed for market analysis and educational purposes.
Trend alignment and consecutive-bar counts should not be considered guaranteed buy or sell signals.
Market conditions can change quickly, and trend indicators may react after price movement has already occurred.
Always perform your own analysis, apply proper risk management, and test the indicator thoroughly before using it with real capital.
Track the trend. Measure its persistence. Confirm the direction.

Clause de non-responsabilité
Les informations et publications ne sont pas destinées à être, et ne constituent pas, des conseils ou recommandations financiers, d'investissement, de trading ou autres fournis ou approuvés par TradingView. Pour en savoir plus, consultez les Conditions d'utilisation.
Clause de non-responsabilité
Les informations et publications ne sont pas destinées à être, et ne constituent pas, des conseils ou recommandations financiers, d'investissement, de trading ou autres fournis ou approuvés par TradingView. Pour en savoir plus, consultez les Conditions d'utilisation.