Apex Algo Engine [AlgoChief]
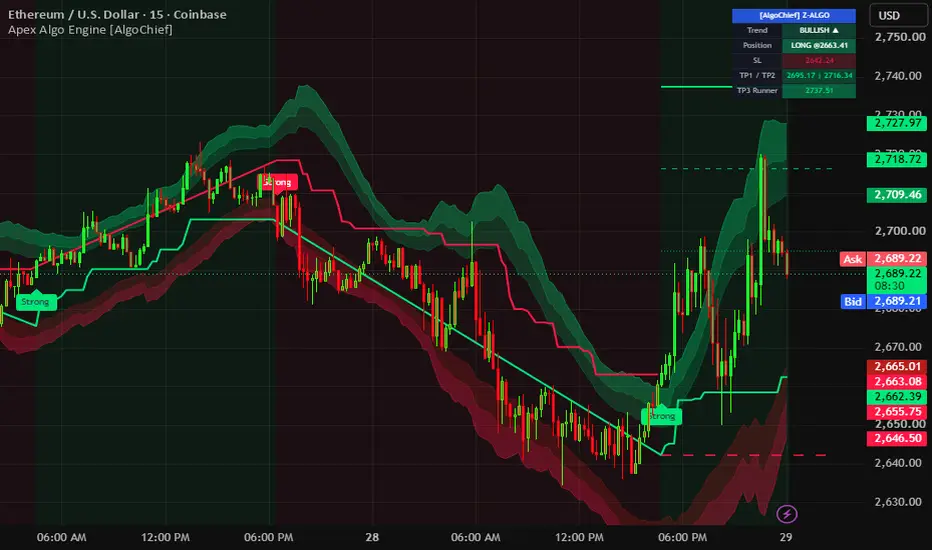
Institutional Trend Engine, Dual Reversal Cloud, Dynamic Trailing Baseline & Precision Risk HUD
OVERVIEW
Apex Algo Engine [AlgoChief] is an advanced, institutional-grade analytical trading toolkit built for TradingView Pine Script v5. Designed to solve the common pitfalls of lagging indicators and cluttered charts, this engine fuses Ordinary Least Squares (OLS) regression, weighted volatility dispersion, and an adaptive stepping baseline into a single, cohesive visual framework.
Whether you are trading equities, indices, forex, or cryptocurrencies, Apex Algo [AlgoChief] delivers a crystal-clear, clutter-free perspective on market trends, momentum expansions, and high-probability trade setups.
█ MAIN FEATURES & HOW THEY WORK
🌊 Dual Reversal Clouds (Equilibrium & Dispersion Bands) Traditional bands use static moving averages that lag during volatile regime shifts. Apex Algo [AlgoChief] calculates a dynamic equilibrium curve using a smoothed least-squares polynomial fit.
• Upper Cloud (Emerald Ribbon): Represents statistical overextension and potential trend resistance. • Lower Cloud (Crimson Ribbon): Represents oversold deviation and dynamic trend support. • Translucent 3D Volumetric Fill: Enables traders to instantly recognize whether price is trading in fair-value territory or compressing against volatility boundaries.
📈 Trend Tracker (Dynamic Stepping Trailing Baseline) The Trend Tracker acts as a smart trailing baseline that follows market structure dynamically: • Bullish Regime (Electric Green Baseline below price): The baseline dynamically ratchets upward as higher highs are formed. During consolidations or minor pullbacks, it locks horizontally into support shelves to prevent premature exits. • Bearish Regime (Electric Crimson Baseline above price): The baseline ratchets downward with price expansion and forms horizontal resistance shelves. • Zero Diagonal Jumps: Plotted with independent conditional logic so your chart remains pristine with no diagonal flip lines across bars.
🎯 High-Probability "Strong" Signals (Strict Alternating Engine) Unlike typical indicators that spam repeated buy and sell labels across multiple candles, Apex Algo [AlgoChief] incorporates a strict 1-Signal-Per-Trend Alternation Engine: • Strong Buy Signal (Vivid Green Badge): Triggers only when the trend flips bullish with verified volatility expansion and momentum breakout. • Strong Sell Signal (Vivid Red Badge): Triggers only when the trend flips bearish with breakdown momentum. • Zero Sticker Spam: Once a Buy is issued, no further Buy signals can print until an opposite Sell condition occurs. This keeps the chart completely uncluttered.
🎨 100% Full Trend Candle Coloring To maximize visual focus and eliminate chart distraction, candle bodies and wicks adapt to the active trend state: • During Uptrends: ALL candles are painted Green (even intraday red/bearish pullbacks remain green so you stay aligned with the broader move). • During Downtrends: ALL candles are painted Red (even intraday green/bullish bounces remain red). • Visual Clarity: Eliminates the psychological urge to prematurely exit winning trends on minor intraday wicks.
🛡️ Integrated Risk Management HUD & Projection Lines Effective risk management is essential to long-term profitability. Apex Algo [AlgoChief] computes mathematical risk targets immediately upon every confirmed signal: • Dynamic Stop Loss (SL): Placed logically at the Trend Tracker baseline or ATR structure. • Take Profit Targets:
TP1: 1:1.5 Risk-to-Reward ratio
TP2: 1:2.5 Risk-to-Reward ratio
TP3 (Runner): 1:3.5 Risk-to-Reward ratio • On-Chart Dynamic Target Lines: Visual dashed and dotted target levels plotted directly from entry. • Corner HUD Table: Compact real-time summary card detailing Market Trend, Active Position, Entry Price, SL, TP1, TP2, TP3, and ATR Volatility Status.
⚡ Optional Contrarian Sniper & S/R Zones (Customizable) For traders seeking extra flexibility, additional institutional tools can be toggled on inside the settings menu: • Contrarian Sniper Badges: Contrarian mean-reversion entries triggered when price deviates significantly (Z-Score > 2.2) beyond the Reversal Cloud. • Exhaustion Dots: Subtle orange circles marking extreme swing peaks and troughs inside the cloud. • Dynamic S/R Retest Zones: Automated horizontal support and resistance boxes generated from historical overbought and oversold pivot swings with ATR vertical padding.
█ THE MATHEMATICAL FOUNDATION
Ordinary Least Squares (OLS) Dynamic Equilibrium The central equilibrium line solves the linear regression model over lookback length N: Minimizing the sum of squared vertical distances from price to the trendline, providing an objective mathematical description of market equilibrium. The resulting curve is double-smoothed using Weighted Moving Averages (WMA) to produce smooth harmonic waves without introducing lag.
Weighted Volatility & Range Metric Rather than relying on static ATR, the cloud dispersion uses a dual-weighted volatility formula: Adaptive Volatility = 0.65 * WMA(True Range, K) + 0.35 * WMA(|Δ Close|, K) This gives higher priority to recent volatility surges and rapid price impulses, allowing the bands to expand smoothly during breakouts and contract gracefully during consolidation.
Non-Repainting Execution All signal logic, trend baseline shifts, and table updates are calculated strictly on confirmed historical bar closes (closed bar basis), ensuring zero repainting on past candles.
█ STEP-BY-STEP TRADING RULES
🟢 Bullish Trade Execution:
Wait for a "Strong" (Green) badge to print below the candle at the close of the bar.
Confirm the Trend Tracker baseline is Electric Green below price.
Candle colors will switch to 100% Green.
Check the HUD Dashboard for your exact Entry Price, suggested Stop Loss, and Take Profit levels (TP1, TP2, TP3).
Ride the trend as long as candles stay Green and price remains above the green baseline.
🔴 Bearish Trade Execution:
Wait for a "Strong" (Red) badge to print above the candle at the close of the bar.
Confirm the Trend Tracker baseline is Electric Red above price.
Candle colors will switch to 100% Red.
Review suggested SL and TP targets on the HUD Table or on-chart lines.
Trail your stop loss downward along the stepping red resistance baseline.
█ RECOMMENDED TIMEFRAMES & SETTINGS
• Scalping (1m - 5m): Trend Multiplier = 1.8 - 2.0 | Cloud Length = 40 - 45 • Day Trading (15m - 30m): Trend Multiplier = 2.2 (Default) | Cloud Length = 55 (Default) • Swing Trading (1h - Daily): Trend Multiplier = 2.4 - 2.8 | Cloud Length = 55 - 65
█ COMPLIANCE & RISK DISCLAIMER
This indicator is developed solely for educational, research, and informational purposes. It does not constitute financial, investment, legal, or trading advice. Trading foreign exchange, equities, commodities, futures, and cryptocurrencies carries substantial risk of loss and is not suitable for every investor. Never risk capital you cannot afford to lose. Always perform your own due diligence and consult with a licensed financial advisor before making any investment decisions.
OVERVIEW
Apex Algo Engine [AlgoChief] is an advanced, institutional-grade analytical trading toolkit built for TradingView Pine Script v5. Designed to solve the common pitfalls of lagging indicators and cluttered charts, this engine fuses Ordinary Least Squares (OLS) regression, weighted volatility dispersion, and an adaptive stepping baseline into a single, cohesive visual framework.
Whether you are trading equities, indices, forex, or cryptocurrencies, Apex Algo [AlgoChief] delivers a crystal-clear, clutter-free perspective on market trends, momentum expansions, and high-probability trade setups.
█ MAIN FEATURES & HOW THEY WORK
🌊 Dual Reversal Clouds (Equilibrium & Dispersion Bands) Traditional bands use static moving averages that lag during volatile regime shifts. Apex Algo [AlgoChief] calculates a dynamic equilibrium curve using a smoothed least-squares polynomial fit.
• Upper Cloud (Emerald Ribbon): Represents statistical overextension and potential trend resistance. • Lower Cloud (Crimson Ribbon): Represents oversold deviation and dynamic trend support. • Translucent 3D Volumetric Fill: Enables traders to instantly recognize whether price is trading in fair-value territory or compressing against volatility boundaries.
📈 Trend Tracker (Dynamic Stepping Trailing Baseline) The Trend Tracker acts as a smart trailing baseline that follows market structure dynamically: • Bullish Regime (Electric Green Baseline below price): The baseline dynamically ratchets upward as higher highs are formed. During consolidations or minor pullbacks, it locks horizontally into support shelves to prevent premature exits. • Bearish Regime (Electric Crimson Baseline above price): The baseline ratchets downward with price expansion and forms horizontal resistance shelves. • Zero Diagonal Jumps: Plotted with independent conditional logic so your chart remains pristine with no diagonal flip lines across bars.
🎯 High-Probability "Strong" Signals (Strict Alternating Engine) Unlike typical indicators that spam repeated buy and sell labels across multiple candles, Apex Algo [AlgoChief] incorporates a strict 1-Signal-Per-Trend Alternation Engine: • Strong Buy Signal (Vivid Green Badge): Triggers only when the trend flips bullish with verified volatility expansion and momentum breakout. • Strong Sell Signal (Vivid Red Badge): Triggers only when the trend flips bearish with breakdown momentum. • Zero Sticker Spam: Once a Buy is issued, no further Buy signals can print until an opposite Sell condition occurs. This keeps the chart completely uncluttered.
🎨 100% Full Trend Candle Coloring To maximize visual focus and eliminate chart distraction, candle bodies and wicks adapt to the active trend state: • During Uptrends: ALL candles are painted Green (even intraday red/bearish pullbacks remain green so you stay aligned with the broader move). • During Downtrends: ALL candles are painted Red (even intraday green/bullish bounces remain red). • Visual Clarity: Eliminates the psychological urge to prematurely exit winning trends on minor intraday wicks.
🛡️ Integrated Risk Management HUD & Projection Lines Effective risk management is essential to long-term profitability. Apex Algo [AlgoChief] computes mathematical risk targets immediately upon every confirmed signal: • Dynamic Stop Loss (SL): Placed logically at the Trend Tracker baseline or ATR structure. • Take Profit Targets:
TP1: 1:1.5 Risk-to-Reward ratio
TP2: 1:2.5 Risk-to-Reward ratio
TP3 (Runner): 1:3.5 Risk-to-Reward ratio • On-Chart Dynamic Target Lines: Visual dashed and dotted target levels plotted directly from entry. • Corner HUD Table: Compact real-time summary card detailing Market Trend, Active Position, Entry Price, SL, TP1, TP2, TP3, and ATR Volatility Status.
⚡ Optional Contrarian Sniper & S/R Zones (Customizable) For traders seeking extra flexibility, additional institutional tools can be toggled on inside the settings menu: • Contrarian Sniper Badges: Contrarian mean-reversion entries triggered when price deviates significantly (Z-Score > 2.2) beyond the Reversal Cloud. • Exhaustion Dots: Subtle orange circles marking extreme swing peaks and troughs inside the cloud. • Dynamic S/R Retest Zones: Automated horizontal support and resistance boxes generated from historical overbought and oversold pivot swings with ATR vertical padding.
█ THE MATHEMATICAL FOUNDATION
Ordinary Least Squares (OLS) Dynamic Equilibrium The central equilibrium line solves the linear regression model over lookback length N: Minimizing the sum of squared vertical distances from price to the trendline, providing an objective mathematical description of market equilibrium. The resulting curve is double-smoothed using Weighted Moving Averages (WMA) to produce smooth harmonic waves without introducing lag.
Weighted Volatility & Range Metric Rather than relying on static ATR, the cloud dispersion uses a dual-weighted volatility formula: Adaptive Volatility = 0.65 * WMA(True Range, K) + 0.35 * WMA(|Δ Close|, K) This gives higher priority to recent volatility surges and rapid price impulses, allowing the bands to expand smoothly during breakouts and contract gracefully during consolidation.
Non-Repainting Execution All signal logic, trend baseline shifts, and table updates are calculated strictly on confirmed historical bar closes (closed bar basis), ensuring zero repainting on past candles.
█ STEP-BY-STEP TRADING RULES
🟢 Bullish Trade Execution:
Wait for a "Strong" (Green) badge to print below the candle at the close of the bar.
Confirm the Trend Tracker baseline is Electric Green below price.
Candle colors will switch to 100% Green.
Check the HUD Dashboard for your exact Entry Price, suggested Stop Loss, and Take Profit levels (TP1, TP2, TP3).
Ride the trend as long as candles stay Green and price remains above the green baseline.
🔴 Bearish Trade Execution:
Wait for a "Strong" (Red) badge to print above the candle at the close of the bar.
Confirm the Trend Tracker baseline is Electric Red above price.
Candle colors will switch to 100% Red.
Review suggested SL and TP targets on the HUD Table or on-chart lines.
Trail your stop loss downward along the stepping red resistance baseline.
█ RECOMMENDED TIMEFRAMES & SETTINGS
• Scalping (1m - 5m): Trend Multiplier = 1.8 - 2.0 | Cloud Length = 40 - 45 • Day Trading (15m - 30m): Trend Multiplier = 2.2 (Default) | Cloud Length = 55 (Default) • Swing Trading (1h - Daily): Trend Multiplier = 2.4 - 2.8 | Cloud Length = 55 - 65
█ COMPLIANCE & RISK DISCLAIMER
This indicator is developed solely for educational, research, and informational purposes. It does not constitute financial, investment, legal, or trading advice. Trading foreign exchange, equities, commodities, futures, and cryptocurrencies carries substantial risk of loss and is not suitable for every investor. Never risk capital you cannot afford to lose. Always perform your own due diligence and consult with a licensed financial advisor before making any investment decisions.

For access & queries: algochiefsupport@gmail.com
Clause de non-responsabilité
Les informations et publications ne sont pas destinées à être, et ne constituent pas, des conseils ou recommandations financiers, d'investissement, de trading ou autres fournis ou approuvés par TradingView. Pour en savoir plus, consultez les Conditions d'utilisation.
For access & queries: algochiefsupport@gmail.com
Clause de non-responsabilité
Les informations et publications ne sont pas destinées à être, et ne constituent pas, des conseils ou recommandations financiers, d'investissement, de trading ou autres fournis ou approuvés par TradingView. Pour en savoir plus, consultez les Conditions d'utilisation.