Mis à jour
Resonance Indicator
**Resonance**
Overview
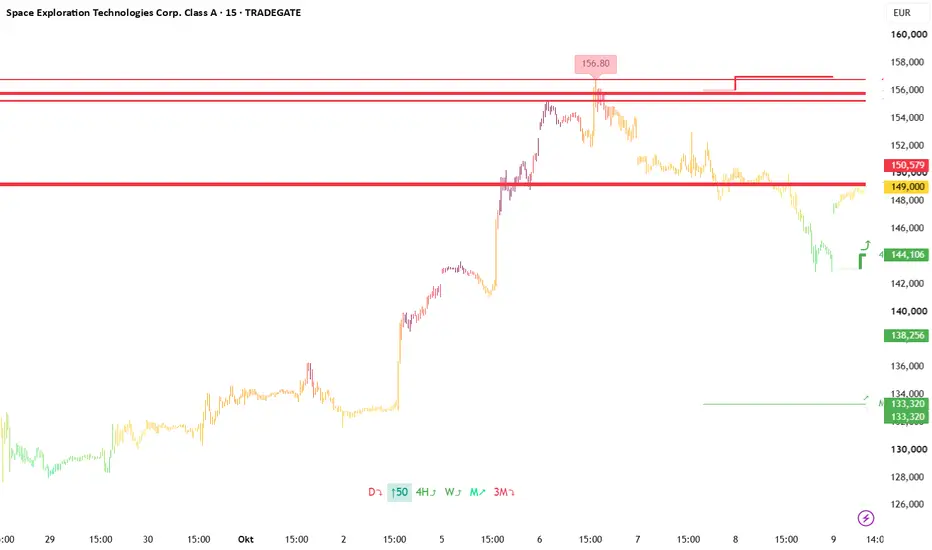
Resonance combines three of my earlier scripts (Multi-Confluence Indicator, Blended Momentum Oscillator, Echo Levels) into one overlay. The goal is simple: show at a glance whether short-term momentum and the higher-timeframe trend agree, and where the most recent momentum turning points were on several timeframes.
Why these parts belong together
All parts are driven by the same momentum oscillator and the same higher-timeframe trend score, so they are connected rather than placed side by side:
- One oscillator colors the candles, creates the pivot labels and places the Echo Levels.
- The higher-timeframe score filters the pivot labels and the alerts, so signals against a strong trend are suppressed.
- The alert message combines price, the recent momentum state on 1h and 15m, and the trend score in one line.
1. Candle colors (momentum)
The oscillator averages a smoothed RSI (14, HMA-smoothed) and a long stochastic (200, EMA-smoothed). It runs from 0 to 100 and colors the candles on a gradient:
- Green/teal: low momentum (below 30, oversold below 20)
- Yellow: neutral (around 50)
- Orange/red/maroon: high momentum (above 70, overbought above 80)
2. Higher-timeframe steplines (trend)
For 4H, D, W, M and 3M, a 7-period HMA is calculated and drawn as a stepline with the timeframe name at the right edge. Arrows on each line show its state:
- ↑ / ↓ trend intact (step in the same direction and at least as large as the previous one)
- ↗ / ↘ trend weakening (same direction, smaller step)
- ⤴ / ⤵ fresh turn (direction just changed)
Higher-timeframe values are taken from the last confirmed bar, so they do not repaint.
3. Trend score and table
The states of 1H, 4H, D, W, M and 3M are weighted by how often they update (1H counts most) and combined into one score. On charts of 1h or lower, a small table at the bottom shows the score symbol, the current oscillator value and all timeframes, sorted by the price level of their lines from top to bottom.
4. Pivot labels
On minute charts, a label marks the extreme price when the 1-minute oscillator forms a pivot above 80 (high) or below 20 (low), but only if the trend score is not strongly in the opposite direction. While the move continues, the label follows the new extreme.
5. Echo Levels
For 1m, 15m, 1h, 4h and D, a horizontal line marks the price of the most recent momentum event on that timeframe: an oscillator pivot high (red), pivot low (green) or a cross of the 50 line (gray). Lines on similar prices are merged into one label. Each level appears only on charts at or below its timeframe.
How to read it
- Candle color tells you short-term momentum.
- Arrows and line order tell you the trend on higher timeframes.
- Echo Levels show where momentum last turned and often act as reference prices.
- The strongest situations are those where momentum, trend score and levels point the same way.
Alerts
Create an alert on the indicator with "Any alert() function call". An alert fires at bar close when an oscillator pivot high or low appears and the trend score does not strongly oppose it. The message contains price, change versus the previous daily close, the 1h and 15m state, and the score.
Limitations
- The oscillator pivots are confirmed one bar after they form.
- Echo Levels and the table use lower-timeframe data that can change until the respective bar closes.
- Steplines are only shown on intraday and daily charts and only cover the most recent stretch of bars.
- This is an analysis tool, not a trading system. It does not predict price and gives no buy or sell recommendation.
Overview
Resonance combines three of my earlier scripts (Multi-Confluence Indicator, Blended Momentum Oscillator, Echo Levels) into one overlay. The goal is simple: show at a glance whether short-term momentum and the higher-timeframe trend agree, and where the most recent momentum turning points were on several timeframes.
Why these parts belong together
All parts are driven by the same momentum oscillator and the same higher-timeframe trend score, so they are connected rather than placed side by side:
- One oscillator colors the candles, creates the pivot labels and places the Echo Levels.
- The higher-timeframe score filters the pivot labels and the alerts, so signals against a strong trend are suppressed.
- The alert message combines price, the recent momentum state on 1h and 15m, and the trend score in one line.
1. Candle colors (momentum)
The oscillator averages a smoothed RSI (14, HMA-smoothed) and a long stochastic (200, EMA-smoothed). It runs from 0 to 100 and colors the candles on a gradient:
- Green/teal: low momentum (below 30, oversold below 20)
- Yellow: neutral (around 50)
- Orange/red/maroon: high momentum (above 70, overbought above 80)
2. Higher-timeframe steplines (trend)
For 4H, D, W, M and 3M, a 7-period HMA is calculated and drawn as a stepline with the timeframe name at the right edge. Arrows on each line show its state:
- ↑ / ↓ trend intact (step in the same direction and at least as large as the previous one)
- ↗ / ↘ trend weakening (same direction, smaller step)
- ⤴ / ⤵ fresh turn (direction just changed)
Higher-timeframe values are taken from the last confirmed bar, so they do not repaint.
3. Trend score and table
The states of 1H, 4H, D, W, M and 3M are weighted by how often they update (1H counts most) and combined into one score. On charts of 1h or lower, a small table at the bottom shows the score symbol, the current oscillator value and all timeframes, sorted by the price level of their lines from top to bottom.
4. Pivot labels
On minute charts, a label marks the extreme price when the 1-minute oscillator forms a pivot above 80 (high) or below 20 (low), but only if the trend score is not strongly in the opposite direction. While the move continues, the label follows the new extreme.
5. Echo Levels
For 1m, 15m, 1h, 4h and D, a horizontal line marks the price of the most recent momentum event on that timeframe: an oscillator pivot high (red), pivot low (green) or a cross of the 50 line (gray). Lines on similar prices are merged into one label. Each level appears only on charts at or below its timeframe.
How to read it
- Candle color tells you short-term momentum.
- Arrows and line order tell you the trend on higher timeframes.
- Echo Levels show where momentum last turned and often act as reference prices.
- The strongest situations are those where momentum, trend score and levels point the same way.
Alerts
Create an alert on the indicator with "Any alert() function call". An alert fires at bar close when an oscillator pivot high or low appears and the trend score does not strongly oppose it. The message contains price, change versus the previous daily close, the 1h and 15m state, and the score.
Limitations
- The oscillator pivots are confirmed one bar after they form.
- Echo Levels and the table use lower-timeframe data that can change until the respective bar closes.
- Steplines are only shown on intraday and daily charts and only cover the most recent stretch of bars.
- This is an analysis tool, not a trading system. It does not predict price and gives no buy or sell recommendation.
Notes de version
Update: 09.10.2026Bug 4h Stepline repaired

Clause de non-responsabilité
Les informations et publications ne sont pas destinées à être, et ne constituent pas, des conseils ou recommandations financiers, d'investissement, de trading ou autres fournis ou approuvés par TradingView. Pour en savoir plus, consultez les Conditions d'utilisation.
Clause de non-responsabilité
Les informations et publications ne sont pas destinées à être, et ne constituent pas, des conseils ou recommandations financiers, d'investissement, de trading ou autres fournis ou approuvés par TradingView. Pour en savoir plus, consultez les Conditions d'utilisation.