PAC CRT Indicator (MTF Scanner + Alerts)
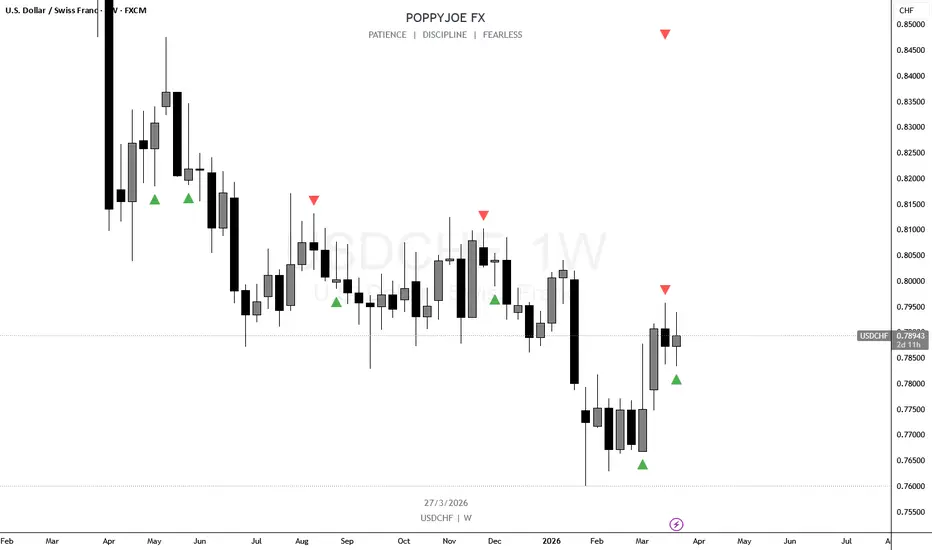
**CRT Indicator (Candle Range Trading) – Multi-Timeframe Scanner & Alerts**
The CRT Indicator is designed to identify high-probability Candle Range Trading (CRT) patterns directly on your chart. It detects both bullish and bearish setups using a precise two-candle formation and enhances decision-making by scanning multiple timeframes simultaneously.
---
### 🔍 What This Indicator Does
This script analyzes price action using two consecutive candles to identify CRT patterns where price manipulates beyond a previous candle’s range and closes back within it.
It automatically:
* Detects **Bullish CRT patterns**
* Detects **Bearish CRT patterns**
* Scans across multiple timeframes (M5, M15, H1, H4)
* Provides real-time **alert notifications**
---
### 📈 CRT Pattern Logic
**Bullish CRT Setup:**
* First candle is bearish
* Second candle is bullish
* Second candle sweeps below the first candle’s low
* Closing price returns within the first candle’s range
**Bearish CRT Setup:**
* First candle is bullish
* Second candle is bearish
* Second candle sweeps above the first candle’s high
* Closing price returns within the first
The CRT Indicator is designed to identify high-probability Candle Range Trading (CRT) patterns directly on your chart. It detects both bullish and bearish setups using a precise two-candle formation and enhances decision-making by scanning multiple timeframes simultaneously.
---
### 🔍 What This Indicator Does
This script analyzes price action using two consecutive candles to identify CRT patterns where price manipulates beyond a previous candle’s range and closes back within it.
It automatically:
* Detects **Bullish CRT patterns**
* Detects **Bearish CRT patterns**
* Scans across multiple timeframes (M5, M15, H1, H4)
* Provides real-time **alert notifications**
---
### 📈 CRT Pattern Logic
**Bullish CRT Setup:**
* First candle is bearish
* Second candle is bullish
* Second candle sweeps below the first candle’s low
* Closing price returns within the first candle’s range
**Bearish CRT Setup:**
* First candle is bullish
* Second candle is bearish
* Second candle sweeps above the first candle’s high
* Closing price returns within the first

Clause de non-responsabilité
Les informations et publications ne sont pas destinées à être, et ne constituent pas, des conseils ou recommandations financiers, d'investissement, de trading ou autres fournis ou approuvés par TradingView. Pour en savoir plus, consultez les Conditions d'utilisation.
Clause de non-responsabilité
Les informations et publications ne sont pas destinées à être, et ne constituent pas, des conseils ou recommandations financiers, d'investissement, de trading ou autres fournis ou approuvés par TradingView. Pour en savoir plus, consultez les Conditions d'utilisation.