True Footprint - Retail vs Institutional Delta Oscillator
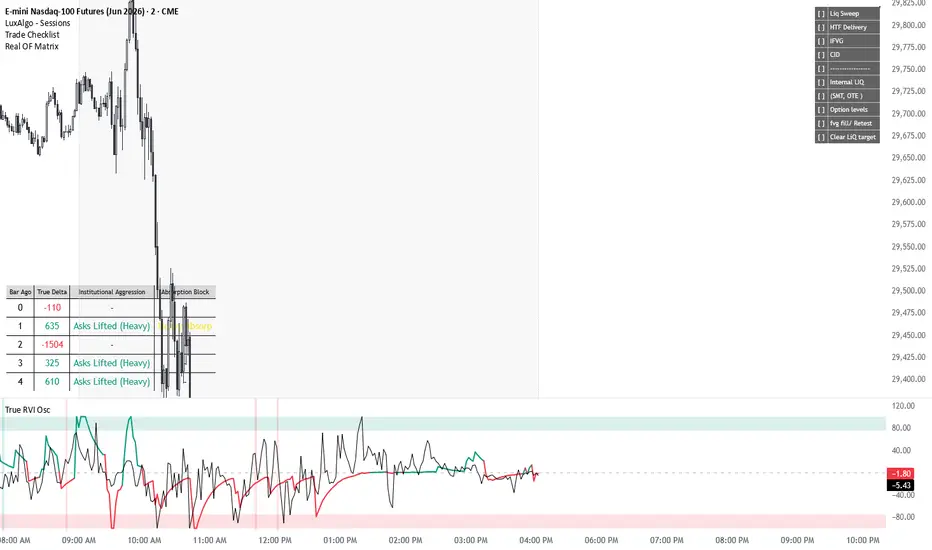
//version=6
indicator("True Footprint - Retail vs Institutional Delta Oscillator", shorttitle="True RVI Osc", overlay=false)
//--- Inputs ---
int_length = input.int(14, title="Institutional Smoothing Length", minval=1)
ret_length = input.int(5, title="Retail Tracking Length", minval=1)
inst_thres = input.float(1.3, title="Institutional Volume Threshold (x Avg)", step=0.1)
show_absorb = input.bool(true, title="Highlight Absorption Zones?")
//--- Core Calculations: True Footprint Data Feed ---
avg_volume = ta.sma(volume, 20)
// ⚡ CRITICAL UPGRADE: Pulling real server-side transaction data matching your matrix script
footprint fp = request.footprint(10, 70)
float true_delta = not na(fp) ? fp.delta() : ((close - open) / (high - low == 0 ? 1 : high - low)) * volume
//--- Separating Retail vs Institutional using True Data ---
float inst_raw = 0.0
float ret_raw = 0.0
// If the transaction volume spikes past the threshold, it is routed to Institutional Flow
if volume > (avg_volume * inst_thres)
inst_raw := true_delta
ret_raw := true_delta * 0.1
else
ret_raw := true_delta
inst_raw := true_delta * 0.05
// Apply individual smoothing to lines
inst_line = ta.ema(inst_raw, int_length)
ret_line = ta.ema(ret_raw, ret_length)
// Normalize values to fit beautifully on the fixed -100 to +100 scale
max_metric = ta.highest(math.max(math.abs(inst_line), math.abs(ret_line)), 100)
max_metric := max_metric == 0 or na(max_metric) ? 1 : max_metric
norm_inst = (inst_line / max_metric) * 100
norm_ret = (ret_line / max_metric) * 100
//--- Zones Highlighting (75 to 100 Green, -75 to -100 Red) ---
h_top = hline(100, title="Top Boundary", display=display.none)
h_zone_g = hline(75, title="Buy Zone Lower", display=display.none)
h_zero = hline(0, title="Zero Line", color=color.new(color.gray, 50), linestyle=hline.style_dashed)
h_zone_r = hline(-75, title="Sell Zone Upper", display=display.none)
h_bot = hline(-100, title="Bottom Boundary", display=display.none)
fill(h_top, h_zone_g, color=color.new(#089981, 85), title="Buy Zone Highlight")
fill(h_bot, h_zone_r, color=color.new(#f23645, 85), title="Sell Zone Highlight")
//--- Plotting the Oscillator Lines ---
// Institutional Line (Thick, changes color based on zero line cross)
plot(norm_inst, title="Institutional Flow Line", color=norm_inst >= 0 ? #089981 : #f23645, linewidth=2)
// Retail Line (Thin Cyan Line)
plot(norm_ret, title="Retail Flow Line", color=color.aqua, linewidth=1)
//--- Advanced Logic: Footprint Absorption Detection ---
bull_absorb = (norm_ret < -20) and (norm_inst > 10) and (close >= open)
bear_absorb = (norm_ret > 20) and (norm_inst < -10) and (close <= open)
bg_color = show_absorb ? (bull_absorb ? color.new(#089981, 85) : (bear_absorb ? color.new(#f23645, 85) : na)) : na
bgcolor(bg_color, title="Absorption Highlight Zones")
//--- Alert Configurations ---
if bull_absorb
alert("Alert: True Footprint Bullish Absorption detected!", alert.freq_once_per_bar)
if bear_absorb
alert("Alert: True Footprint Bearish Absorption detected!", alert.freq_once_per_bar)
indicator("True Footprint - Retail vs Institutional Delta Oscillator", shorttitle="True RVI Osc", overlay=false)
//--- Inputs ---
int_length = input.int(14, title="Institutional Smoothing Length", minval=1)
ret_length = input.int(5, title="Retail Tracking Length", minval=1)
inst_thres = input.float(1.3, title="Institutional Volume Threshold (x Avg)", step=0.1)
show_absorb = input.bool(true, title="Highlight Absorption Zones?")
//--- Core Calculations: True Footprint Data Feed ---
avg_volume = ta.sma(volume, 20)
// ⚡ CRITICAL UPGRADE: Pulling real server-side transaction data matching your matrix script
footprint fp = request.footprint(10, 70)
float true_delta = not na(fp) ? fp.delta() : ((close - open) / (high - low == 0 ? 1 : high - low)) * volume
//--- Separating Retail vs Institutional using True Data ---
float inst_raw = 0.0
float ret_raw = 0.0
// If the transaction volume spikes past the threshold, it is routed to Institutional Flow
if volume > (avg_volume * inst_thres)
inst_raw := true_delta
ret_raw := true_delta * 0.1
else
ret_raw := true_delta
inst_raw := true_delta * 0.05
// Apply individual smoothing to lines
inst_line = ta.ema(inst_raw, int_length)
ret_line = ta.ema(ret_raw, ret_length)
// Normalize values to fit beautifully on the fixed -100 to +100 scale
max_metric = ta.highest(math.max(math.abs(inst_line), math.abs(ret_line)), 100)
max_metric := max_metric == 0 or na(max_metric) ? 1 : max_metric
norm_inst = (inst_line / max_metric) * 100
norm_ret = (ret_line / max_metric) * 100
//--- Zones Highlighting (75 to 100 Green, -75 to -100 Red) ---
h_top = hline(100, title="Top Boundary", display=display.none)
h_zone_g = hline(75, title="Buy Zone Lower", display=display.none)
h_zero = hline(0, title="Zero Line", color=color.new(color.gray, 50), linestyle=hline.style_dashed)
h_zone_r = hline(-75, title="Sell Zone Upper", display=display.none)
h_bot = hline(-100, title="Bottom Boundary", display=display.none)
fill(h_top, h_zone_g, color=color.new(#089981, 85), title="Buy Zone Highlight")
fill(h_bot, h_zone_r, color=color.new(#f23645, 85), title="Sell Zone Highlight")
//--- Plotting the Oscillator Lines ---
// Institutional Line (Thick, changes color based on zero line cross)
plot(norm_inst, title="Institutional Flow Line", color=norm_inst >= 0 ? #089981 : #f23645, linewidth=2)
// Retail Line (Thin Cyan Line)
plot(norm_ret, title="Retail Flow Line", color=color.aqua, linewidth=1)
//--- Advanced Logic: Footprint Absorption Detection ---
bull_absorb = (norm_ret < -20) and (norm_inst > 10) and (close >= open)
bear_absorb = (norm_ret > 20) and (norm_inst < -10) and (close <= open)
bg_color = show_absorb ? (bull_absorb ? color.new(#089981, 85) : (bear_absorb ? color.new(#f23645, 85) : na)) : na
bgcolor(bg_color, title="Absorption Highlight Zones")
//--- Alert Configurations ---
if bull_absorb
alert("Alert: True Footprint Bullish Absorption detected!", alert.freq_once_per_bar)
if bear_absorb
alert("Alert: True Footprint Bearish Absorption detected!", alert.freq_once_per_bar)

Clause de non-responsabilité
Les informations et publications ne sont pas destinées à être, et ne constituent pas, des conseils ou recommandations financiers, d'investissement, de trading ou autres fournis ou approuvés par TradingView. Pour en savoir plus, consultez les Conditions d'utilisation.
Clause de non-responsabilité
Les informations et publications ne sont pas destinées à être, et ne constituent pas, des conseils ou recommandations financiers, d'investissement, de trading ou autres fournis ou approuvés par TradingView. Pour en savoir plus, consultez les Conditions d'utilisation.