OPEN-SOURCE SCRIPT
Mis à jour Euphoria Momentum Oscillator
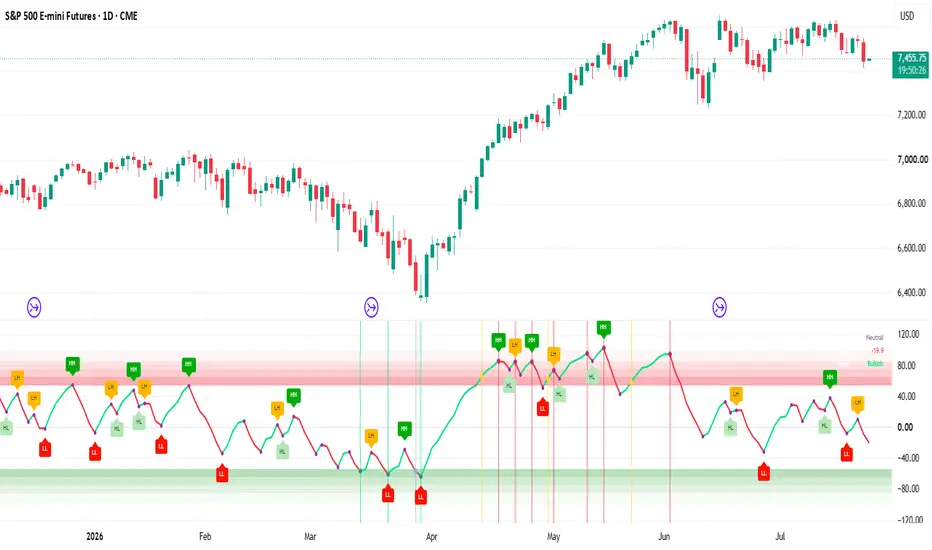
📊 Euphoria Momentum Oscillator
🧾 Brief Description
A momentum oscillator that combines WaveTrend-style smoothing, adaptive overbought/oversold zones, and signal-line pivot detection to visualize momentum expansion, exhaustion, and reversals.
📖 Full Description
🔍 Overview
The Euphoria Momentum Oscillator is a smooth momentum tracking tool designed to help you understand market emotion cycles inside price action.
Instead of only showing overbought/oversold levels, it builds a continuous momentum wave that highlights:
📈 Momentum expansion
📉 Momentum exhaustion
🔄 Potential reversal zones
⚖️ Trend pressure shifts
It is built for context, not prediction, helping traders read structure inside momentum behavior.
⚙️ Core Engine
At its core, the indicator:
Builds a smoothed momentum wave from price deviation
Applies dual-layer smoothing to reduce noise
Scales movement using an amplitude multiplier for adaptability
👉 Result: a clean oscillator that reacts smoothly to market cycles.
📡 Signal Logic
A hidden signal line is used to detect momentum turning points.
This helps identify:
🔴 Peak momentum exhaustion (possible reversal down)
🟢 Trough momentum exhaustion (possible reversal up)
⚡ Transition phases between expansion & contraction
These signals are only shown when structure confirms a shift — not raw noise.
🌡️ Market Zones
The oscillator uses dynamic sentiment zones:
🔴 Overbought zone (Euphoria region)
→ Momentum may be extended or overheating
🟢 Oversold zone (Fear region)
→ Momentum may be oversold or exhausted
👉 These zones are contextual, not direct buy/sell signals.
🎯 Visual Language
🟢 Rising line = increasing bullish momentum
🔴 Falling line = increasing bearish momentum
🌈 Gradient zones = intensity of emotional pressure
🟡 Yellow dots = entry into extreme zone
🔴 / 🟢 dots = confirmed momentum pivot points
📊 Dashboard
A built-in dashboard shows:
📌 Sentiment state (Fear / Neutral / Euphoria)
📊 Current oscillator value
📉 Trend bias vs 50 EMA
This helps quickly understand market context at a glance.
🔔 Alerts
You can set alerts for:
🚨 Entering Euphoria zone (overbought pressure)
🚨 Entering Fear zone (oversold pressure)
📉 Momentum peak formation
📈 Momentum trough formation
All alerts are triggered only after structural confirmation.
⚙️ Inputs
Customize:
Channel length (momentum sensitivity)
Smoothing strength
Signal line speed
Amplitude scaling
Overbought / oversold thresholds
Visual vertical lines toggle
🧠 How to Use
Best used for:
📈 Momentum tracking
🔄 Reversal context spotting
📊 Trend continuation vs exhaustion analysis
🧩 Multi-timeframe confirmation setups
👉 Works best when combined with:
Price structure
Support/resistance
Trend indicators
⚠️ Limitations
This is a context tool, not a prediction system.
Momentum extremes can persist in strong trends
Signals should not be used alone
Confirmation from price action is recommended
💡 Originality
This indicator is not a standard oscillator.
It introduces:
🌊 WaveTrend-inspired momentum engine
🧠 Dual smoothing architecture
📡 Signal-line pivot detection
🌡️ Adaptive sentiment zones
📊 Structured dashboard context layer
👉 The goal is to transform raw momentum into readable market emotion cycles, not just overbought/oversold signals.
🧾 Brief Description
A momentum oscillator that combines WaveTrend-style smoothing, adaptive overbought/oversold zones, and signal-line pivot detection to visualize momentum expansion, exhaustion, and reversals.
📖 Full Description
🔍 Overview
The Euphoria Momentum Oscillator is a smooth momentum tracking tool designed to help you understand market emotion cycles inside price action.
Instead of only showing overbought/oversold levels, it builds a continuous momentum wave that highlights:
📈 Momentum expansion
📉 Momentum exhaustion
🔄 Potential reversal zones
⚖️ Trend pressure shifts
It is built for context, not prediction, helping traders read structure inside momentum behavior.
⚙️ Core Engine
At its core, the indicator:
Builds a smoothed momentum wave from price deviation
Applies dual-layer smoothing to reduce noise
Scales movement using an amplitude multiplier for adaptability
👉 Result: a clean oscillator that reacts smoothly to market cycles.
📡 Signal Logic
A hidden signal line is used to detect momentum turning points.
This helps identify:
🔴 Peak momentum exhaustion (possible reversal down)
🟢 Trough momentum exhaustion (possible reversal up)
⚡ Transition phases between expansion & contraction
These signals are only shown when structure confirms a shift — not raw noise.
🌡️ Market Zones
The oscillator uses dynamic sentiment zones:
🔴 Overbought zone (Euphoria region)
→ Momentum may be extended or overheating
🟢 Oversold zone (Fear region)
→ Momentum may be oversold or exhausted
👉 These zones are contextual, not direct buy/sell signals.
🎯 Visual Language
🟢 Rising line = increasing bullish momentum
🔴 Falling line = increasing bearish momentum
🌈 Gradient zones = intensity of emotional pressure
🟡 Yellow dots = entry into extreme zone
🔴 / 🟢 dots = confirmed momentum pivot points
📊 Dashboard
A built-in dashboard shows:
📌 Sentiment state (Fear / Neutral / Euphoria)
📊 Current oscillator value
📉 Trend bias vs 50 EMA
This helps quickly understand market context at a glance.
🔔 Alerts
You can set alerts for:
🚨 Entering Euphoria zone (overbought pressure)
🚨 Entering Fear zone (oversold pressure)
📉 Momentum peak formation
📈 Momentum trough formation
All alerts are triggered only after structural confirmation.
⚙️ Inputs
Customize:
Channel length (momentum sensitivity)
Smoothing strength
Signal line speed
Amplitude scaling
Overbought / oversold thresholds
Visual vertical lines toggle
🧠 How to Use
Best used for:
📈 Momentum tracking
🔄 Reversal context spotting
📊 Trend continuation vs exhaustion analysis
🧩 Multi-timeframe confirmation setups
👉 Works best when combined with:
Price structure
Support/resistance
Trend indicators
⚠️ Limitations
This is a context tool, not a prediction system.
Momentum extremes can persist in strong trends
Signals should not be used alone
Confirmation from price action is recommended
💡 Originality
This indicator is not a standard oscillator.
It introduces:
🌊 WaveTrend-inspired momentum engine
🧠 Dual smoothing architecture
📡 Signal-line pivot detection
🌡️ Adaptive sentiment zones
📊 Structured dashboard context layer
👉 The goal is to transform raw momentum into readable market emotion cycles, not just overbought/oversold signals.
Notes de version
📊 Euphoria Momentum Oscillator — Visual & Alert Update🧾 Brief Description
This update adds clearer identification of fear-zone entries and oscillator direction changes without modifying the indicator’s underlying momentum engine, smoothing, thresholds, pivot logic, or dashboard.
📖 What’s New
🔵 Fear-Zone Entry Marker
An Electric Blue dot now appears when the oscillator crosses below the configured oversold/fear threshold.
When vertical lines are enabled, a matching Electric Blue vertical line marks the same event.
This complements the existing Yellow marker used when the oscillator crosses above the overbought/euphoria threshold.
🟣 Momentum Direction-Change Marker
A small Purple dot now appears whenever the oscillator changes direction:
Green/rising to Red/falling
Red/falling to Green/rising
The Purple dot follows the same rising/falling logic used to color the oscillator line.
It does not generate a vertical line and should be interpreted as a momentum-direction change—not necessarily a confirmed market trend reversal.
🔔 New Alert
Added:
🟣 Changing Trend Alert
This alert triggers whenever the oscillator switches between its rising and falling states.
For closed-candle confirmation, configure the TradingView alert using Once Per Bar Close.
🎨 Visual Improvements
Added Electric Blue fear-zone entry dots.
Added matching Electric Blue fear-entry vertical lines.
Added small Purple momentum direction-change dots.
Preserved the existing Yellow, Red, and Green signal markers.
🛠️ Alert Improvements
Added the new Purple direction-change alert.
Corrected corrupted emoji characters in existing alert names.
Standardized the fear-zone alert to use the same condition as its Electric Blue marker.
⚙️ Unchanged Components
This update does not change:
Momentum calculation
WaveTrend-style smoothing
Amplitude scaling
Default zone thresholds
Hidden signal-line pivot detection
Red and Green pivot logic
50 EMA dashboard trend reading
⚠️ Important Note
All markers describe oscillator conditions. They are contextual momentum signals and should not be interpreted as guaranteed buy, sell, or price-reversal signals.
May God Bless your trading and your investments !!
Notes de version
📊 Euphoria Momentum Oscillator — Purple Dot Alignment Update🧾 Brief Description
This update improves the visual placement of the Purple momentum direction-change marker. It does not modify the oscillator engine or provide earlier signal detection.
📖 What Changed
🟣 Improved Purple Dot Alignment
The Purple dot is now displayed on the preceding oscillator peak or trough associated with a confirmed change in direction.
This makes the marker visually align with the point where the oscillator transitions between:
Rising and falling momentum
Falling and rising momentum
🔔 Alert Timing
The 🟣 Changing Trend Alert continues to trigger on the candle where the direction change is detected.
The alert is not moved backward and cannot trigger retrospectively on the preceding pivot candle.
For closed-candle confirmation, configure the alert using Once Per Bar Close.
⚠️ Placement Disclosure
The Purple dot is positioned on the preceding pivot only after the following candle detects the direction change. Therefore, its historical placement should not be interpreted as a signal that was available on the pivot candle itself.
While the current realtime candle remains open, the condition may change as price updates.
⚙️ Unchanged Components
This update does not change:
Momentum calculations
Smoothing parameters
Amplitude scaling
Euphoria and Fear thresholds
Zone-entry signals
Red and Green pivot signals
Alert conditions or messages
Dashboard calculations
Vertical-line behavior
👉 This is a visual-alignment update only.
Notes de version
🚀 Release Notes — Euphoria Momentum Oscillator📈 Market-Structure Banners
Added automatic oscillator structure classification:
🟢 HH — Higher High
🔵 HL — Higher Low
🟠 LH — Lower High
🔴 LL — Lower Low
Highs are compared only with previous highs, while lows are compared only with previous lows.
🎯 Improved Banner Placement
Every banner is positioned near the oscillator turn that triggered it:
HH appears above its high pivot.
LL appears below its low pivot.
LH appears slightly above its high pivot.
HL appears slightly below its low pivot.
The offsets prevent banners from hiding the existing red, green, and purple dots.
Two new settings allow customization:
HH / LL Banner Offset
HL / LH Banner Offset
🔔 New Alerts
Added individual alert conditions for:
Higher High (HH)
Higher Low (HL)
Lower High (LH)
Lower Low (LL)
🧹 Existing Features Preserved
The update retains:
Euphoria and Fear zones
Red and green pivot dots
Purple direction-change dots
Zone-entry markers and vertical lines
Momentum coloring
Sentiment and trend dashboard
⚠️ Signal-Timing Disclosure
Structure is confirmed when the oscillator changes direction:
The banner is placed on the preceding turning bar.
The corresponding alert fires on the current confirmation bar.
The first detected high and low cannot be classified because a previous equivalent pivot is required.
These labels describe oscillator momentum structure and do not guarantee a price-trend reversal.
Notes de version
🎯 Release Notes — Zone-Aware Structure FilteringThis update improves how HH and LL banners are preserved based on their oscillator location.
🧠 Smarter relevance rules
🟢 HH is considered most meaningful in the Greed zone.
🔴 LL is considered most meaningful in the Fear zone.
⚖️ Both HH and LL remain relevant in the middle zone.
An LL occurring in Greed is displayed live but not preserved.
An HH occurring in Fear is displayed live but not preserved.
Live-only banners are automatically removed when the next structure pivot appears.
🔔 Alerts continue to trigger when every new structure candidate is displayed.
This keeps developing structure visible in real time while producing a cleaner and more contextually relevant historical chart.
⚠️ Market-structure banners are analytical references and should not be considered standalone trading signals.
Script open-source
Dans l'esprit TradingView, le créateur de ce script l'a rendu open source afin que les traders puissent examiner et vérifier ses fonctionnalités. Bravo à l'auteur! Bien que vous puissiez l'utiliser gratuitement, n'oubliez pas que la republication du code est soumise à nos Règles.

Clause de non-responsabilité
Les informations et publications ne sont pas destinées à être, et ne constituent pas, des conseils ou recommandations financiers, d'investissement, de trading ou autres fournis ou approuvés par TradingView. Pour en savoir plus, consultez les Conditions d'utilisation.
Script open-source
Dans l'esprit TradingView, le créateur de ce script l'a rendu open source afin que les traders puissent examiner et vérifier ses fonctionnalités. Bravo à l'auteur! Bien que vous puissiez l'utiliser gratuitement, n'oubliez pas que la republication du code est soumise à nos Règles.
Clause de non-responsabilité
Les informations et publications ne sont pas destinées à être, et ne constituent pas, des conseils ou recommandations financiers, d'investissement, de trading ou autres fournis ou approuvés par TradingView. Pour en savoir plus, consultez les Conditions d'utilisation.