Opening Range & Session Breakouts [CandleChasers]
Opening Range & Session Breakouts [CandleChasers]
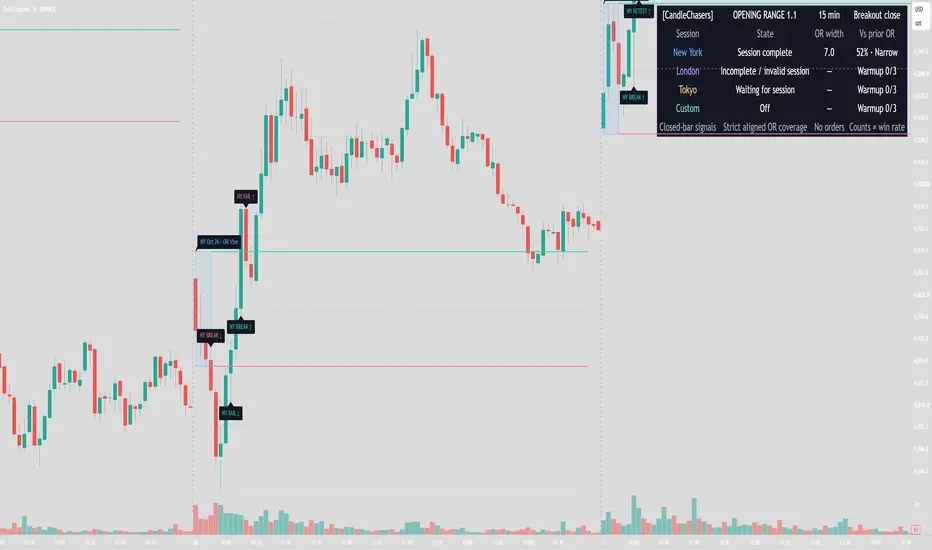
A session-based opening range indicator for tracking completed range levels, closing breakouts, retests, and failed breakouts. Independent session windows, optional qualification filters, range extensions, historical drawings, and configurable alerts provide a consistent framework for intraday analysis.
OPENING RANGE
Choose a 5-, 15-, 30-, or 60-minute opening range, or enter a custom duration.
The indicator tracks the opening high and low, then locks the levels when the opening window completes. An optional midpoint and three configurable extension pairs provide additional price references.
Extensions are measured in multiples of the completed range width. They are reference levels, not risk multiples or guaranteed price targets.
FOUR INDEPENDENT SESSION WINDOWS
• New York: 09:30–16:00, New York time.
• London: 08:00–16:30, London time.
• Tokyo: 09:00–15:00, Tokyo time.
• Custom: adjustable hours, including overnight sessions.
New York is enabled by default. Each window maintains its own opening range, signal state, historical drawings, and prior-range baseline.
The custom session includes an easy timezone dropdown with common locations, UTC, Exchange timezone, and a Custom IANA option. Regional selections follow their local daylight-saving rules. Exchange timezone uses the symbol’s exchange timezone; changing the chart’s display timezone does not change the calculation.
Session presets are analysis windows, not an automatic exchange holiday calendar.
TWO MAIN SIGNAL MODES
Breakout close: A main signal occurs when a completed candle makes a qualifying transition beyond the locked range boundary and any configured breakout buffer.
Retest confirmation: A qualifying breakout starts a pending setup. The main signal waits for a later candle to overlap the boundary’s tolerance band and close beyond the breakout trigger within the selected deadline.
An optional directional-candle requirement adds another condition to retest confirmation. Breakout filters are evaluated at the initial breakout and are not reapplied at the retest.
Signals cannot occur on the candle that locks the opening range.
FAILED-BREAKOUT CLASSIFICATION
Following a qualified breakout, the indicator monitors for a completed candle returning through the original broken boundary.
A return within the configured failure window receives a failed-breakout classification. A later return can still cancel a pending retest without receiving that classification.
Failure takes priority when a candle could otherwise satisfy competing conditions. A confirmed retest can subsequently fail, so breakout, retest, and failure counts are pattern observations—not separate winning or losing trades.
OPTIONAL QUALIFICATION FILTERS
Enable filters individually to require:
• A directional breakout candle body relative to ATR.
• Relative volume compared with the previous chart candles.
• Opening range width within selected ATR bounds.
• Opening range width within selected bounds relative to previous valid opening ranges.
Filters default off. If the relative-volume filter is enabled, unavailable volume prevents qualification.
A filtered-out crossing is not accepted later simply because price remains outside the range; a fresh qualifying crossing is required.
Additional controls include one qualified breakout per direction per session, a cutoff for new breakout attempts, retest tolerance, and retest and failure deadlines.
RANGE-SIZE CONTEXT
Each session compares its completed opening range with its own prior valid opening ranges.
The dashboard identifies relatively narrow, typical, or wide ranges. The current range is excluded from its comparison baseline, and incomplete opening windows do not contribute.
This describes range size; it does not predict market direction.
DISPLAY AND ALERTS
• Opening range boxes, high, low, and optional midpoint.
• Three adjustable extension pairs.
• Configurable completed-session history.
• Price labels positioned above their lines.
• Session and event tooltips.
• Dashboard sizes: Small, Medium, Large, or Hidden.
• Adjustable dashboard corner.
• Separate alert conditions for main signals, qualified breakouts, retests, failures, and range completion.
• Aggregated alert() messages with session identification and range boundaries.
Input values are hidden from the status line to preserve chart space.
RANGE INTEGRITY AND CONFIRMATION
The opening window must have complete, contiguous chart-bar coverage. Missing opening bars, candles that straddle the opening-range end, or a flat range make the window ineligible for signals.
Persistent range state, event classifications, and alerts use completed chart candles. An optional visual preview can show the developing opening range during the current candle; that preview is provisional.
Multiple enabled sessions operate independently and can produce different directional observations on the same candle.
GETTING STARTED
1. Use a standard time-based intraday candlestick chart.
2. Start with the default 15-minute New York opening range on an aligned 1- or 5-minute chart.
3. Confirm that the chart’s session settings and data feed include the configured opening window.
4. Choose Breakout close or Retest confirmation.
5. Enable additional sessions and filters as needed.
6. Review dashboard warnings before interpreting signals.
Opening boundaries must align with the chart’s candles. A smaller chart timeframe may be necessary for custom opening durations or session times.
PURPOSE AND LIMITATIONS
Opening range analysis is an established method. This implementation combines independent session tracking, strict opening-window coverage checks, distinct breakout/retest/failure states, prior-range context, and configurable presentation in one indicator.
It calculates from chart bars without lower-timeframe reconstruction. Results depend on the symbol, feed, available history, chart timeframe, and session settings. Feed revisions or changes in loaded history can alter recalculated results.
This is a visual analysis indicator. It places no orders and provides no strategy backtest, verified win rate, or claimed trading edge. Range extensions and pattern signals do not guarantee continuation, reversal, or profitability.
A session-based opening range indicator for tracking completed range levels, closing breakouts, retests, and failed breakouts. Independent session windows, optional qualification filters, range extensions, historical drawings, and configurable alerts provide a consistent framework for intraday analysis.
OPENING RANGE
Choose a 5-, 15-, 30-, or 60-minute opening range, or enter a custom duration.
The indicator tracks the opening high and low, then locks the levels when the opening window completes. An optional midpoint and three configurable extension pairs provide additional price references.
Extensions are measured in multiples of the completed range width. They are reference levels, not risk multiples or guaranteed price targets.
FOUR INDEPENDENT SESSION WINDOWS
• New York: 09:30–16:00, New York time.
• London: 08:00–16:30, London time.
• Tokyo: 09:00–15:00, Tokyo time.
• Custom: adjustable hours, including overnight sessions.
New York is enabled by default. Each window maintains its own opening range, signal state, historical drawings, and prior-range baseline.
The custom session includes an easy timezone dropdown with common locations, UTC, Exchange timezone, and a Custom IANA option. Regional selections follow their local daylight-saving rules. Exchange timezone uses the symbol’s exchange timezone; changing the chart’s display timezone does not change the calculation.
Session presets are analysis windows, not an automatic exchange holiday calendar.
TWO MAIN SIGNAL MODES
Breakout close: A main signal occurs when a completed candle makes a qualifying transition beyond the locked range boundary and any configured breakout buffer.
Retest confirmation: A qualifying breakout starts a pending setup. The main signal waits for a later candle to overlap the boundary’s tolerance band and close beyond the breakout trigger within the selected deadline.
An optional directional-candle requirement adds another condition to retest confirmation. Breakout filters are evaluated at the initial breakout and are not reapplied at the retest.
Signals cannot occur on the candle that locks the opening range.
FAILED-BREAKOUT CLASSIFICATION
Following a qualified breakout, the indicator monitors for a completed candle returning through the original broken boundary.
A return within the configured failure window receives a failed-breakout classification. A later return can still cancel a pending retest without receiving that classification.
Failure takes priority when a candle could otherwise satisfy competing conditions. A confirmed retest can subsequently fail, so breakout, retest, and failure counts are pattern observations—not separate winning or losing trades.
OPTIONAL QUALIFICATION FILTERS
Enable filters individually to require:
• A directional breakout candle body relative to ATR.
• Relative volume compared with the previous chart candles.
• Opening range width within selected ATR bounds.
• Opening range width within selected bounds relative to previous valid opening ranges.
Filters default off. If the relative-volume filter is enabled, unavailable volume prevents qualification.
A filtered-out crossing is not accepted later simply because price remains outside the range; a fresh qualifying crossing is required.
Additional controls include one qualified breakout per direction per session, a cutoff for new breakout attempts, retest tolerance, and retest and failure deadlines.
RANGE-SIZE CONTEXT
Each session compares its completed opening range with its own prior valid opening ranges.
The dashboard identifies relatively narrow, typical, or wide ranges. The current range is excluded from its comparison baseline, and incomplete opening windows do not contribute.
This describes range size; it does not predict market direction.
DISPLAY AND ALERTS
• Opening range boxes, high, low, and optional midpoint.
• Three adjustable extension pairs.
• Configurable completed-session history.
• Price labels positioned above their lines.
• Session and event tooltips.
• Dashboard sizes: Small, Medium, Large, or Hidden.
• Adjustable dashboard corner.
• Separate alert conditions for main signals, qualified breakouts, retests, failures, and range completion.
• Aggregated alert() messages with session identification and range boundaries.
Input values are hidden from the status line to preserve chart space.
RANGE INTEGRITY AND CONFIRMATION
The opening window must have complete, contiguous chart-bar coverage. Missing opening bars, candles that straddle the opening-range end, or a flat range make the window ineligible for signals.
Persistent range state, event classifications, and alerts use completed chart candles. An optional visual preview can show the developing opening range during the current candle; that preview is provisional.
Multiple enabled sessions operate independently and can produce different directional observations on the same candle.
GETTING STARTED
1. Use a standard time-based intraday candlestick chart.
2. Start with the default 15-minute New York opening range on an aligned 1- or 5-minute chart.
3. Confirm that the chart’s session settings and data feed include the configured opening window.
4. Choose Breakout close or Retest confirmation.
5. Enable additional sessions and filters as needed.
6. Review dashboard warnings before interpreting signals.
Opening boundaries must align with the chart’s candles. A smaller chart timeframe may be necessary for custom opening durations or session times.
PURPOSE AND LIMITATIONS
Opening range analysis is an established method. This implementation combines independent session tracking, strict opening-window coverage checks, distinct breakout/retest/failure states, prior-range context, and configurable presentation in one indicator.
It calculates from chart bars without lower-timeframe reconstruction. Results depend on the symbol, feed, available history, chart timeframe, and session settings. Feed revisions or changes in loaded history can alter recalculated results.
This is a visual analysis indicator. It places no orders and provides no strategy backtest, verified win rate, or claimed trading edge. Range extensions and pattern signals do not guarantee continuation, reversal, or profitability.

Clause de non-responsabilité
Les informations et publications ne sont pas destinées à être, et ne constituent pas, des conseils ou recommandations financiers, d'investissement, de trading ou autres fournis ou approuvés par TradingView. Pour en savoir plus, consultez les Conditions d'utilisation.
Clause de non-responsabilité
Les informations et publications ne sont pas destinées à être, et ne constituent pas, des conseils ou recommandations financiers, d'investissement, de trading ou autres fournis ou approuvés par TradingView. Pour en savoir plus, consultez les Conditions d'utilisation.