OPEN-SOURCE SCRIPT
Fundamental Dashboard [Standalone]
Overview
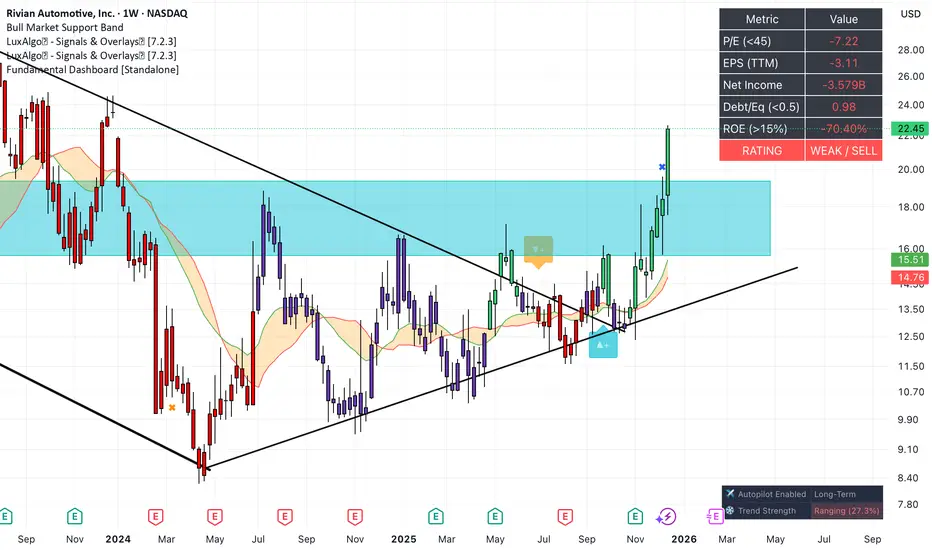
The Fundamental Strength Dashboard is a streamlined utility designed to evaluate the fundamental health of a stock directly on your chart. Instead of relying solely on price action, this indicator fetches real-time financial data to assess profitability, valuation, and financial stability.
It aggregates five core financial metrics into a single "Fundamental Score" (0-5) and displays a clear rating (Strong Buy, Buy, Neutral, or Weak/Sell) in a customizable dashboard table.
How It Works
The script analyzes the following 5 Key Fundamental Metrics. For a stock to receive a "point" for a specific metric, it must meet the criteria defined in your settings:
Net Income (Profitability): Checks if the company is actually profitable (Net Income > 0).
EPS (Earnings Per Share): Ensures the company has positive Earnings Per Share (TTM).
P/E Ratio (Valuation): Checks if the stock is valued reasonably compared to your maximum threshold (default: < 45).
Debt-to-Equity (Leverage): Analyzes financial risk. Lower is better (default: < 0.5).
ROE (Efficiency): Measures how effectively management uses equity to generate profit (default: > 15%).
The Scoring System
The indicator calculates a cumulative score based on how many of the above criteria are met:
Score 5/5 → STRONG BUY: The stock meets all profitability, valuation, and stability criteria.
Score 4/5 → BUY: The stock misses only one criterion but is otherwise fundamentally sound.
Score 0-3 → WEAK / SELL: The stock fails multiple fundamental checks (e.g., negative earnings, high debt, or overvaluation).
Features & Customization
Every trader has different risk appetites and sector preferences. You can fully customize the thresholds in the Settings menu:
Max P/E Threshold: Adjust this based on the sector (e.g., Tech stocks typically have higher P/Es than Utilities).
Min ROE %: Set your requirement for management efficiency.
Max Debt/Equity: Tighten or loosen leverage requirements.
Visuals: Change the table position (Top Right, Bottom Right, etc.) and color scheme to match your chart theme.
How to Use
Add the indicator to your chart.
Open the Settings (Gear icon).
Adjust the Dynamic Thresholds to fit the sector you are trading.
Look at the dashboard on the chart to see a snapshot of the stock's fundamental health.
Disclaimer
This script is for educational and informational purposes only. It relies on third-party financial data provided by TradingView, which may occasionally be missing or delayed. Always do your own research (DYOR) before making investment decisions.
The Fundamental Strength Dashboard is a streamlined utility designed to evaluate the fundamental health of a stock directly on your chart. Instead of relying solely on price action, this indicator fetches real-time financial data to assess profitability, valuation, and financial stability.
It aggregates five core financial metrics into a single "Fundamental Score" (0-5) and displays a clear rating (Strong Buy, Buy, Neutral, or Weak/Sell) in a customizable dashboard table.
How It Works
The script analyzes the following 5 Key Fundamental Metrics. For a stock to receive a "point" for a specific metric, it must meet the criteria defined in your settings:
Net Income (Profitability): Checks if the company is actually profitable (Net Income > 0).
EPS (Earnings Per Share): Ensures the company has positive Earnings Per Share (TTM).
P/E Ratio (Valuation): Checks if the stock is valued reasonably compared to your maximum threshold (default: < 45).
Debt-to-Equity (Leverage): Analyzes financial risk. Lower is better (default: < 0.5).
ROE (Efficiency): Measures how effectively management uses equity to generate profit (default: > 15%).
The Scoring System
The indicator calculates a cumulative score based on how many of the above criteria are met:
Score 5/5 → STRONG BUY: The stock meets all profitability, valuation, and stability criteria.
Score 4/5 → BUY: The stock misses only one criterion but is otherwise fundamentally sound.
Score 0-3 → WEAK / SELL: The stock fails multiple fundamental checks (e.g., negative earnings, high debt, or overvaluation).
Features & Customization
Every trader has different risk appetites and sector preferences. You can fully customize the thresholds in the Settings menu:
Max P/E Threshold: Adjust this based on the sector (e.g., Tech stocks typically have higher P/Es than Utilities).
Min ROE %: Set your requirement for management efficiency.
Max Debt/Equity: Tighten or loosen leverage requirements.
Visuals: Change the table position (Top Right, Bottom Right, etc.) and color scheme to match your chart theme.
How to Use
Add the indicator to your chart.
Open the Settings (Gear icon).
Adjust the Dynamic Thresholds to fit the sector you are trading.
Look at the dashboard on the chart to see a snapshot of the stock's fundamental health.
Disclaimer
This script is for educational and informational purposes only. It relies on third-party financial data provided by TradingView, which may occasionally be missing or delayed. Always do your own research (DYOR) before making investment decisions.
Script open-source
Dans l'esprit TradingView, le créateur de ce script l'a rendu open source afin que les traders puissent examiner et vérifier ses fonctionnalités. Bravo à l'auteur! Bien que vous puissiez l'utiliser gratuitement, n'oubliez pas que la republication du code est soumise à nos Règles.

Clause de non-responsabilité
Les informations et publications ne sont pas destinées à être, et ne constituent pas, des conseils ou recommandations financiers, d'investissement, de trading ou autres fournis ou approuvés par TradingView. Pour en savoir plus, consultez les Conditions d'utilisation.
Script open-source
Dans l'esprit TradingView, le créateur de ce script l'a rendu open source afin que les traders puissent examiner et vérifier ses fonctionnalités. Bravo à l'auteur! Bien que vous puissiez l'utiliser gratuitement, n'oubliez pas que la republication du code est soumise à nos Règles.
Clause de non-responsabilité
Les informations et publications ne sont pas destinées à être, et ne constituent pas, des conseils ou recommandations financiers, d'investissement, de trading ou autres fournis ou approuvés par TradingView. Pour en savoir plus, consultez les Conditions d'utilisation.