UM Market Internals Oscillator: TICK TRIN VWAP SCORE
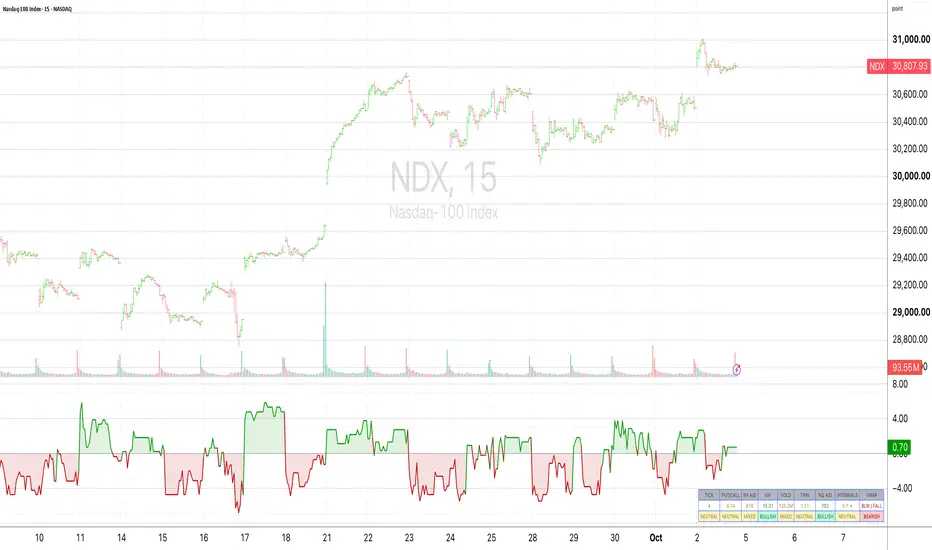
UM Market Internals Oscillator: TICK / PUT-CALL / ADV-DEC / VIX / VOLD / TRIN / NQ A-D / VWAP / SCORE
SUMMARY
One pane that answers a single question: is the broad market confirming the move you see on your chart? The indicator reads seven market internals plus VWAP, rates each one in plain words, and combines them into a single weighted Internals Score that runs from about -12 (broad selling) to +12 (broad buying). The score is plotted as an oscillator, and a table shows every component's current value and rating.
DESCRIPTION
WHAT IT MEASURES
- TICK: NYSE stocks on an uptick minus stocks on a downtick. Fast read on immediate buying or selling pressure.
- NYSE Advance/Decline: advancing minus declining NYSE stocks. Breadth of participation.
- NASDAQ Advance/Decline: the same breadth measure for Nasdaq stocks. Useful for QQQ and technology-heavy trading.
- VOLD: NYSE up volume minus down volume. Shows whether volume is backing the breadth.
- TRIN (Arms Index): compares advancing/declining stocks with advancing/declining volume. Lower is bullish, higher is bearish.
- VIX direction: a moving average of VIX. Falling is bullish for equities, rising is bearish. Direction matters here, not the level.
- VWAP: where the chart symbol's price sits relative to its VWAP, and whether VWAP is rising, flat or falling.
- Put/Call ratio: shown in the table with a contrarian rating, but deliberately left out of the score.
HOW THE SCORE IS BUILT
Each component is rated against thresholds (for example BUYING, EXTREME SELL, STRONG BULL, NEUTRAL). The rating becomes a base score from -2 to +2 (VIX is -1 or +1), which is multiplied by that component's weight. The weighted values are added together.
Default weights:
- VOLD 1.25
- NYSE A/D 1.15
- TRIN 1.05
- NASDAQ A/D 0.90
- VIX 0.80
- TICK 0.75
- VWAP 0.50
VOLD and breadth carry the most weight because they describe actual participation. TICK is weighted lower because it is noisy. VWAP is price-derived rather than a true internal, so its contribution is capped at plus or minus 1 by default. Setting any weight to 0 removes that component from the score.
READING THE SCORE
- +7 or higher: STRONG BULL
- +3 to +7: BULLISH
- between -3 and +3: NEUTRAL
- -3 to -7: BEARISH
- -7 or lower: STRONG BEAR
Dotted lines mark +3 and -3, dashed lines mark +7 and -7. The oscillator is green above zero and red below. In the table, the INTERNALS column shows the score with an arrow for whether it rose or fell from the previous bar.
HOW TO USE IT
- Confirmation: a price breakout with the score above +3 and rising has broad support. A breakout with the score near zero is being carried by a narrow group of stocks.
- Divergence: price making new highs while the score makes lower highs is a warning that participation is fading. The mirror applies at lows.
- Disagreement: the table shows which components disagree with the rest, for example strong breadth with weak volume.
- Extremes: CLIMAX and CAPITULATION readings confirm strong momentum, but after an extended move they can also mark short-term exhaustion.
DISPLAY MODES
Line + Table (default), Histogram + Table, Line + Histogram + Table, or Table Only. The table can be placed in any corner.
SETTINGS
- Internals TF (default 3 minutes): the timeframe used to sample TICK, Put/Call, both A/D lines, VOLD and TRIN. Use 5 or 15 minutes for a smoother, slower read. VIX is sampled on the chart's timeframe.
- Thresholds: every rating threshold is adjustable.
- VIX MA: EMA (default, length 8), SMA, WMA or a Nadaraya-Watson estimate.
- VWAP: source, the "at VWAP" distance, and the flat-slope threshold.
- Weights: one per component.
- Symbols: each data symbol can be changed if your data feed uses different tickers.
Every input has a tooltip explaining what it does and what the default means.
ALERTS
- Internals: Bullish (score crosses up through +3)
- Internals: Strong Bull (score crosses up through +7)
- Internals: Bearish (score crosses down through -3)
- Internals: Strong Bear (score crosses down through -7)
Use "Once per bar close" if you only want confirmed readings, since the score can move while a bar is forming.
NOTES
- Built for intraday charts of US index products such as SPX, SPY, XSP, ES, QQQ and NQ during regular US market hours. The internals do not update outside those hours.
- VWAP is calculated on the chart symbol, so that symbol needs volume data. On symbols without volume the VWAP column shows NO DATA and adds nothing to the score.
- The default weights are a starting point, not an optimized result. Adjust them to your market and timeframe and test before relying on them.
- This indicator describes market conditions. It does not generate buy or sell signals and is not financial advice.
SUMMARY
One pane that answers a single question: is the broad market confirming the move you see on your chart? The indicator reads seven market internals plus VWAP, rates each one in plain words, and combines them into a single weighted Internals Score that runs from about -12 (broad selling) to +12 (broad buying). The score is plotted as an oscillator, and a table shows every component's current value and rating.
DESCRIPTION
WHAT IT MEASURES
- TICK: NYSE stocks on an uptick minus stocks on a downtick. Fast read on immediate buying or selling pressure.
- NYSE Advance/Decline: advancing minus declining NYSE stocks. Breadth of participation.
- NASDAQ Advance/Decline: the same breadth measure for Nasdaq stocks. Useful for QQQ and technology-heavy trading.
- VOLD: NYSE up volume minus down volume. Shows whether volume is backing the breadth.
- TRIN (Arms Index): compares advancing/declining stocks with advancing/declining volume. Lower is bullish, higher is bearish.
- VIX direction: a moving average of VIX. Falling is bullish for equities, rising is bearish. Direction matters here, not the level.
- VWAP: where the chart symbol's price sits relative to its VWAP, and whether VWAP is rising, flat or falling.
- Put/Call ratio: shown in the table with a contrarian rating, but deliberately left out of the score.
HOW THE SCORE IS BUILT
Each component is rated against thresholds (for example BUYING, EXTREME SELL, STRONG BULL, NEUTRAL). The rating becomes a base score from -2 to +2 (VIX is -1 or +1), which is multiplied by that component's weight. The weighted values are added together.
Default weights:
- VOLD 1.25
- NYSE A/D 1.15
- TRIN 1.05
- NASDAQ A/D 0.90
- VIX 0.80
- TICK 0.75
- VWAP 0.50
VOLD and breadth carry the most weight because they describe actual participation. TICK is weighted lower because it is noisy. VWAP is price-derived rather than a true internal, so its contribution is capped at plus or minus 1 by default. Setting any weight to 0 removes that component from the score.
READING THE SCORE
- +7 or higher: STRONG BULL
- +3 to +7: BULLISH
- between -3 and +3: NEUTRAL
- -3 to -7: BEARISH
- -7 or lower: STRONG BEAR
Dotted lines mark +3 and -3, dashed lines mark +7 and -7. The oscillator is green above zero and red below. In the table, the INTERNALS column shows the score with an arrow for whether it rose or fell from the previous bar.
HOW TO USE IT
- Confirmation: a price breakout with the score above +3 and rising has broad support. A breakout with the score near zero is being carried by a narrow group of stocks.
- Divergence: price making new highs while the score makes lower highs is a warning that participation is fading. The mirror applies at lows.
- Disagreement: the table shows which components disagree with the rest, for example strong breadth with weak volume.
- Extremes: CLIMAX and CAPITULATION readings confirm strong momentum, but after an extended move they can also mark short-term exhaustion.
DISPLAY MODES
Line + Table (default), Histogram + Table, Line + Histogram + Table, or Table Only. The table can be placed in any corner.
SETTINGS
- Internals TF (default 3 minutes): the timeframe used to sample TICK, Put/Call, both A/D lines, VOLD and TRIN. Use 5 or 15 minutes for a smoother, slower read. VIX is sampled on the chart's timeframe.
- Thresholds: every rating threshold is adjustable.
- VIX MA: EMA (default, length 8), SMA, WMA or a Nadaraya-Watson estimate.
- VWAP: source, the "at VWAP" distance, and the flat-slope threshold.
- Weights: one per component.
- Symbols: each data symbol can be changed if your data feed uses different tickers.
Every input has a tooltip explaining what it does and what the default means.
ALERTS
- Internals: Bullish (score crosses up through +3)
- Internals: Strong Bull (score crosses up through +7)
- Internals: Bearish (score crosses down through -3)
- Internals: Strong Bear (score crosses down through -7)
Use "Once per bar close" if you only want confirmed readings, since the score can move while a bar is forming.
NOTES
- Built for intraday charts of US index products such as SPX, SPY, XSP, ES, QQQ and NQ during regular US market hours. The internals do not update outside those hours.
- VWAP is calculated on the chart symbol, so that symbol needs volume data. On symbols without volume the VWAP column shows NO DATA and adds nothing to the score.
- The default weights are a starting point, not an optimized result. Adjust them to your market and timeframe and test before relying on them.
- This indicator describes market conditions. It does not generate buy or sell signals and is not financial advice.

David Franck
Clause de non-responsabilité
Les informations et publications ne sont pas destinées à être, et ne constituent pas, des conseils ou recommandations financiers, d'investissement, de trading ou autres fournis ou approuvés par TradingView. Pour en savoir plus, consultez les Conditions d'utilisation.
David Franck
Clause de non-responsabilité
Les informations et publications ne sont pas destinées à être, et ne constituent pas, des conseils ou recommandations financiers, d'investissement, de trading ou autres fournis ou approuvés par TradingView. Pour en savoir plus, consultez les Conditions d'utilisation.