OPEN-SOURCE SCRIPT
EonMetrics CISD
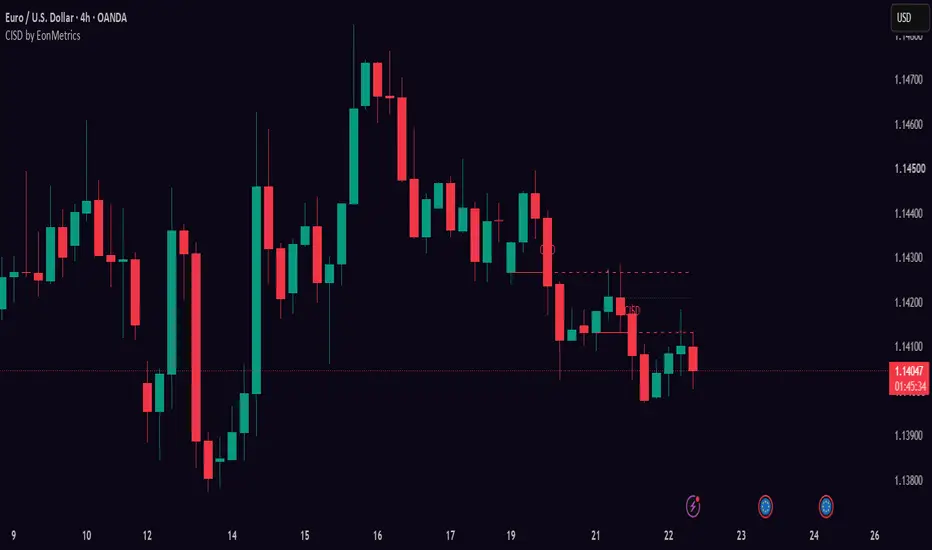
CISD — Change In State of Delivery
CISD marks the moment the market's delivery flips. Price is "delivered" in one direction through a series of consecutive same-direction candles; the open of the first candle of that series is the delivery level. When a later candle closes back through that level, the state of delivery has changed — that close is the CISD. The level is then kept on the chart and tracked as support or resistance, with retest and invalidation handling.

🔶HOW IT WORKS
The script counts consecutive same-direction candles (by candle body, by default). When such a series ends, the open of its FIRST candle is remembered as the delivery level, shown as a dotted pending line. When a later candle CLOSES through that level against the series direction, the CISD is confirmed — the level is drawn and tracked as support or resistance from that bar on.
🔶HOW CISD DIFFERS FROM MSS / BOS
Structure tools (MSS, BOS, CHoCH) need a swing pivot: a high or low must form and be confirmed by candles on both sides before a break of it means anything. CISD needs no pivot at all — the reference level comes straight from the candle series itself (the open of the first candle of the last delivery leg). That is why a CISD typically confirms earlier than a structure shift: the close through the series origin often prints several bars before the equivalent MSS. Earlier also means less filtered — CISD is a faster, more granular read of the same idea, not a replacement for structure.
🔶WHAT IT DOES
Series detection — counts consecutive same-direction candles (direction by candle body, or optionally close-vs-previous-close). A series qualifies as delivery once it reaches the minimum length you set. A doji can either ride the series or end it — your choice.
Pending level (dotted) — as soon as a qualifying series ends, the open of its first candle becomes the candidate level, drawn as a dotted line. This is where the next CISD would confirm. Nothing is signaled yet — the line just shows you what the market has to close through.
Confirmed CISD (solid) — when a candle closes through the pending level, the level turns solid, gets its CISD label, and starts being tracked: bullish CISD levels act as support, bearish as resistance.
Level lifecycle — an active level extends bar by bar. When price fully leaves it and later returns to touch it, that touch is marked as a retest (wick-based). When a candle closes back through the level, it is invalidated — removed, or kept dimmed on the chart if you prefer to study failures. An optional lifetime cap quietly expires old levels.
Current delivery state — an optional floating label shows the running series direction and its candle count (e.g. "Bearish x4").

🔶NON-REPAINTING
The entire engine advances on confirmed bars only. Nothing is drawn, moved or deleted intrabar: a pending level appears only after its series is complete, a CISD confirms only on a closed candle, and retests/breaks are evaluated on closed candles. What you see on a historical chart is exactly what you would have seen live.
🔶ALERTS
Six alert conditions: bullish/bearish CISD confirmed, bullish/bearish level retested, bullish/bearish level broken.
🔶HOW TO USE
1. Keep Min Series Length at 2 for a responsive read, raise to 3-4 to only mark the strongest delivery legs.
2. Watch the dotted pending line — it tells you in advance which level a close has to take out for delivery to flip.
3. After a confirmed CISD, the level itself is the tradeable information: bullish CISD levels tend to act as support on the retest, bearish as resistance.
4. Set alerts on confirmations and retests instead of watching the chart.
🔶SETTINGS
Detection (min series length, candle direction mode, doji handling) · Levels (max active per side, lifetime, keep broken, retest markers, pending line) · Style (colors, line width, label size, delivery-state label).
This tool annotates delivery levels. It does not predict direction, does not generate entries and has no targets — what you do at a level is your decision.
Part of the EonMetrics toolset.
CISD marks the moment the market's delivery flips. Price is "delivered" in one direction through a series of consecutive same-direction candles; the open of the first candle of that series is the delivery level. When a later candle closes back through that level, the state of delivery has changed — that close is the CISD. The level is then kept on the chart and tracked as support or resistance, with retest and invalidation handling.
🔶HOW IT WORKS
The script counts consecutive same-direction candles (by candle body, by default). When such a series ends, the open of its FIRST candle is remembered as the delivery level, shown as a dotted pending line. When a later candle CLOSES through that level against the series direction, the CISD is confirmed — the level is drawn and tracked as support or resistance from that bar on.
🔶HOW CISD DIFFERS FROM MSS / BOS
Structure tools (MSS, BOS, CHoCH) need a swing pivot: a high or low must form and be confirmed by candles on both sides before a break of it means anything. CISD needs no pivot at all — the reference level comes straight from the candle series itself (the open of the first candle of the last delivery leg). That is why a CISD typically confirms earlier than a structure shift: the close through the series origin often prints several bars before the equivalent MSS. Earlier also means less filtered — CISD is a faster, more granular read of the same idea, not a replacement for structure.
🔶WHAT IT DOES
Series detection — counts consecutive same-direction candles (direction by candle body, or optionally close-vs-previous-close). A series qualifies as delivery once it reaches the minimum length you set. A doji can either ride the series or end it — your choice.
Pending level (dotted) — as soon as a qualifying series ends, the open of its first candle becomes the candidate level, drawn as a dotted line. This is where the next CISD would confirm. Nothing is signaled yet — the line just shows you what the market has to close through.
Confirmed CISD (solid) — when a candle closes through the pending level, the level turns solid, gets its CISD label, and starts being tracked: bullish CISD levels act as support, bearish as resistance.
Level lifecycle — an active level extends bar by bar. When price fully leaves it and later returns to touch it, that touch is marked as a retest (wick-based). When a candle closes back through the level, it is invalidated — removed, or kept dimmed on the chart if you prefer to study failures. An optional lifetime cap quietly expires old levels.
Current delivery state — an optional floating label shows the running series direction and its candle count (e.g. "Bearish x4").
🔶NON-REPAINTING
The entire engine advances on confirmed bars only. Nothing is drawn, moved or deleted intrabar: a pending level appears only after its series is complete, a CISD confirms only on a closed candle, and retests/breaks are evaluated on closed candles. What you see on a historical chart is exactly what you would have seen live.
🔶ALERTS
Six alert conditions: bullish/bearish CISD confirmed, bullish/bearish level retested, bullish/bearish level broken.
🔶HOW TO USE
1. Keep Min Series Length at 2 for a responsive read, raise to 3-4 to only mark the strongest delivery legs.
2. Watch the dotted pending line — it tells you in advance which level a close has to take out for delivery to flip.
3. After a confirmed CISD, the level itself is the tradeable information: bullish CISD levels tend to act as support on the retest, bearish as resistance.
4. Set alerts on confirmations and retests instead of watching the chart.
🔶SETTINGS
Detection (min series length, candle direction mode, doji handling) · Levels (max active per side, lifetime, keep broken, retest markers, pending line) · Style (colors, line width, label size, delivery-state label).
This tool annotates delivery levels. It does not predict direction, does not generate entries and has no targets — what you do at a level is your decision.
Part of the EonMetrics toolset.
Script open-source
Dans l'esprit TradingView, le créateur de ce script l'a rendu open source afin que les traders puissent examiner et vérifier ses fonctionnalités. Bravo à l'auteur! Bien que vous puissiez l'utiliser gratuitement, n'oubliez pas que la republication du code est soumise à nos Règles.

Clause de non-responsabilité
Les informations et publications ne sont pas destinées à être, et ne constituent pas, des conseils ou recommandations financiers, d'investissement, de trading ou autres fournis ou approuvés par TradingView. Pour en savoir plus, consultez les Conditions d'utilisation.
Script open-source
Dans l'esprit TradingView, le créateur de ce script l'a rendu open source afin que les traders puissent examiner et vérifier ses fonctionnalités. Bravo à l'auteur! Bien que vous puissiez l'utiliser gratuitement, n'oubliez pas que la republication du code est soumise à nos Règles.
Clause de non-responsabilité
Les informations et publications ne sont pas destinées à être, et ne constituent pas, des conseils ou recommandations financiers, d'investissement, de trading ou autres fournis ou approuvés par TradingView. Pour en savoir plus, consultez les Conditions d'utilisation.