MTF Structure Console - Sreeni
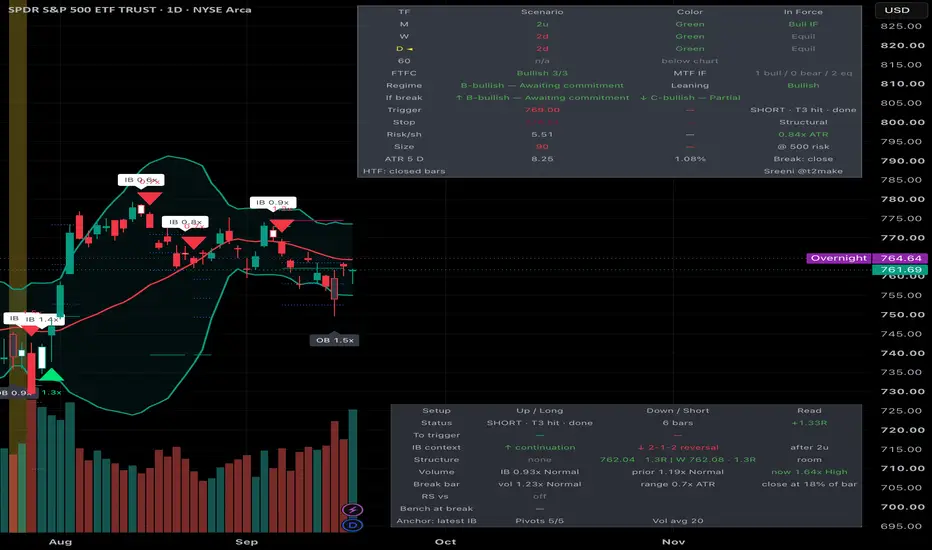
MTF Structure Console
by Sreeni
What it does
Combines Bollinger Bands with Strat-style bar classification, multi-timeframe regime context, pre-computed trade levels, and the context a swing trader needs to judge a breakout: volume, structure in the way, and strength relative to the market. A two-candle pattern is never read in isolation.
Most inside-bar indicators mark the pattern and stop there. This one answers the questions that come after: what are the higher timeframes doing, what would the regime become if this bar breaks, where is the trigger, where does the stop go, how wide is the risk relative to normal range, is there a prior high in the way before the first target, and did the break happen on real participation.
Bar classification
Every bar is labelled against the prior bar on the same timeframe:
1 — Inside bar. Range contained within the prior bar. Compression.
2u / 2d — Directional. One side of the prior bar broken.
3 — Outside bar. Both sides broken. Expansion.
Inside bars are coloured and labelled "IB", outside bars "OB". A 3 followed by a 1 — maximum expansion into maximum compression — is highlighted across both candles.
An option controls whether a bar that merely equals the prior high or low counts as having broken that side. The default treats equality as non-breaking, which catches inside bars that a strict greater-than test misses. The same rule is applied to the chart and to every row of the regime table, so the two never disagree about the same bar.
Multi-timeframe regime table
Four configurable timeframes (Monthly / Weekly / Daily / 60m by default), each showing:
Scenario label (1 / 2u / 2d / 3)
Bar colour (close vs open)
In Force state — whether the close has actually cleared the prior bar's high or low, rather than merely drifting inside it
The row matching the chart timeframe is marked. A timeframe below the chart cannot be read from chart bars, so it is shown as n/a and left out of the aggregates rather than shown as a meaningless number.
Then the aggregates:
FTFC — do all readable timeframes agree in colour; when mixed, how many are green and how many red
MTF In Force — how many have genuinely broken prior structure, split into bull / bear / equilibrium so that "3 of 4 committed" cannot hide two bulls and a bear
Regime grade — A (full alignment) through N (standby / chop):
A: colour agreement and In Force in the same direction on every readable timeframe
B: colour agreement on all, but at least one timeframe still in equilibrium
C: all but one agree in colour, and the two highest timeframes are among them
D: anything more conflicted than C
N: the decision timeframe is an inside bar, or the two highest timeframes are opposite colours
If break — the grade the regime would have if the current chart bar broke up, and if it broke down. This is computed by substituting a 2u / 2d reading for the chart timeframe's row and re-running the grade. It tells you which side the higher timeframes support before the break happens. Shown only when the chart timeframe is one of the four table rows.
Agreement and commitment are deliberately kept separate. An instrument can be green on all four timeframes while never clearing a prior high; that is drift, not a breakout, and the table shows the difference.
On repainting: by default every higher-timeframe value comes from the last closed bar on that timeframe, so nothing in the table repaints. The offset is applied only to timeframes above the chart; a row equal to the chart timeframe uses the current bar, which is already complete at the close. A toggle switches to the live forming bar if you prefer current-but-provisional readings. The table footer states which mode is active.
Trigger levels, breaks and setup status
When an inside bar forms, the script projects:
Trigger lines at the bar's high and low, extending right until one is taken out. The pattern is the setup; the break is the event.
Stop levels, both directions, dashed until a break resolves which one applies.
R-multiple targets (default 1R / 2R / 3R) projected from the trigger once a break occurs.
Position size for your stated per-trade risk.
What counts as a break. By default the bar must close beyond the trigger on a completed bar — the same test the table uses for In Force. A wick through the level that closes back inside is not a break; it is usually the opposite. A "Wick" mode is available for traders who enter on the touch, evaluated live.
If a single bar takes out both sides of the inside bar (a 1-3), the direction is decided by its close. If it closes back inside the range, nothing has resolved and the setup keeps watching.
With consecutive inside bars, the triggers can re-anchor to each new narrower bar (default) or stay on the first bar of the run until its outer range breaks.
Setup status. After a break the levels stay on screen and the script keeps tracking the setup for a configurable number of bars: the status row reads Watching → Long / Short active → T1 / T2 / T3 hit, or Failed if the bar closes back inside the inside-bar range before any target is reached, or Stopped if the stop level trades. Bars since the break and the running R (distance from entry in units of initial risk) are shown alongside.
Two stop methods:
Structural + ATR buffer (default) — the stop sits beyond the opposite side of the inside bar, pushed out by a fraction of ATR. The level has a thesis behind it: if price re-enters the range, the setup is invalidated regardless of what volatility says. The ATR buffer pushes it past the wick where obvious stops sit.
ATR from trigger — a fixed ATR distance from the entry level. Simpler and uniform, but it can land inside the bar's own range, where normal movement takes you out.
ATR is frozen at the signal bar and held for the life of the setup. A level that recalculates every bar drifts, and a drifting stop is not a stop.
ATR is a simple average of true range over a configurable length (default 5), read from a configurable timeframe, defaulting to daily. A swing stop should respect the instrument's daily range even when the pattern is found intraday. If the chart timeframe is higher than the ATR timeframe, the chart timeframe is used instead, so a weekly inside bar is measured against weekly ranges rather than being rejected for being wider than a day.
Risk filter
Structural risk is expressed as a multiple of ATR and shown in the table. Setups above your threshold (default 1.5x ATR) are rejected outright — no lines, no alerts. When the stop is that far away, position size shrinks until the trade stops being worth the slot.
Most of the value here is in the setups that never get drawn.
Setup table (optional, off by default)
A second table carries the context around the setup:
Distance to trigger from the current close, in ATR and percent, both directions — whether to be watching tonight or next week.
Inside-bar context — what preceded the inside bar decides what each break means. After a 2d, an upside break is a 2-1-2 reversal and a downside break is continuation; after a 2u the reverse; after a 3 it is a 3-1 resolving.
Structure in the way — the nearest prior pivot high above the trigger and pivot low below it, each expressed as a distance in R, plus the prior completed bar's high / low on the second table timeframe (weekly by default). If the nearest structure sits under a configurable distance (default 1R), the row flags "into structure": the first obstacle arrives before the first target. Prior pivots are treated as targets, not support or resistance — they are where the last group of traders was trapped and where the move tends to travel before deciding. A pivot is defined by a configurable number of bars either side (default 5 / 5), so it is confirmed and never repaints, and is always that many bars stale.
Volume — ratio to the prior N-bar average (default 20), for the inside bar, the bar before it, and the current bar. Tiers: Low under 0.7x, Normal, High above 1.5x, Climax above 2.5x (all configurable). A live intraday bar carries partial volume, so its ratio is projected by the fraction of the session elapsed and marked "proj". Hidden on instruments that report no volume.
Break bar — the break bar's volume ratio, its range as a multiple of ATR, and where it closed within its own range. A wide-range, high-volume bar closing near its extreme is a different event from a narrow churn bar closing mid-range.
Relative strength versus a configurable benchmark (default SPY): the instrument's return over two lookbacks (default 20 and 60 bars) minus the benchmark's, on the chart timeframe. Positive means it outperformed. The benchmark's own bar state is shown, and at the moment of a break the script records whether the benchmark broke too or was itself an inside bar — a break that happens without the index is noted as such. Set the benchmark to a sector ETF if that is the comparison that matters for your names.
Alerts
Nine conditions: inside bar, outside bar, 3-1 pattern, the two trigger breaks, break on elevated volume, failed break, stop hit, and target 1 hit.
Breaks can be gated so they only fire when the direction agrees with the higher-timeframe leaning, and optionally when relative strength agrees too, which cuts alert volume sharply. Break alerts respect the close / wick setting.
A dynamic alert() is also included, carrying the actual trigger price, stop, risk per share, break-bar volume, regime grade and relative strength in the message. Select "Any alert() function call" when creating it.
Settings worth knowing
Break confirmation (default Close). Change it to Wick only if you know why.
Signal only on closed bars (default on). With it off, a live inside bar can become an outside bar before the close and labels shift accordingly.
Text sizes — table body, table headers, IB/OB labels, break arrows and level prices each have independent size controls, Tiny through Huge.
Timeframes are inputs, not hardcoded. Swing traders working a 4H execution timeframe can set W/D/4H/1H, and the "If break" row then reads the 4H row.
Risk per trade drives the position-size column. Set it to your actual figure or the numbers mean nothing.
Price labels on the chart are off by default; every level is in the tables.
How to use it
Read the regime table first. Grade N or D means stand aside regardless of what the candles look like. Then read "If break": if only one side leads to an A or B, that is the side worth waiting for.
Find the inside bar. It is a watchlist item, not an entry. Open the setup table and check what preceded it and whether there is structure inside 1R.
Wait for the close beyond the trigger line. That is the only permission.
Check the break bar: was it on volume, was it wide, did it close near its extreme, did the index break with it or not.
Check risk in ATR terms before sizing. If it is wide, it is wide — reduce or skip.
The stop level is where the premise fails. If you are moving it, you are no longer trading the setup. A failed break — a close back inside the range — is the setup telling you it was wrong.
Known limitations
Markers are drawn as label objects so their size can be configured; TradingView caps these at 500 per chart, so the oldest drop off as you scroll back. Bar colouring and background highlights are unaffected.
The regime grade flags a decision-timeframe inside bar as standby. That is intentional — the decision timeframe has not committed yet — and the "If break" row exists precisely to show what happens once it does.
Stop levels are decision levels. A resting order fills at whatever an opening gap gives you, and no ATR buffer protects against that.
Relative strength on an intraday chart compares bars that may not align exactly if the benchmark trades different session hours. On daily and above this does not arise.
Volume projection for a live bar assumes volume arrives evenly through the session, which it does not; treat the projected figure as a rough gauge.
Credit
Bar classification follows the scenario framework popularised by Rob Smith (TheStrat). The Bollinger Band, ATR and pivot calculations are standard. Everything else — the regime grading, conditional grading, trigger projection, setup state tracking, ATR stop logic, risk filter, sizing, volume tiers and relative-strength readout — is original work in this script.
Author: Sreeni — @t2make
Educational tool — not trading advice
This indicator is published for learning and research purposes only.
It describes the structure of past and current price action using a fixed, published rule set. It does not predict future price movement, does not generate buy or sell recommendations, and is not investment, financial, legal or tax advice. Nothing here is a solicitation to trade any instrument.
No representation is made that any account will or is likely to achieve profits or losses similar to anything shown or described. Past chart behaviour does not indicate future results. Trading and investing involve substantial risk of loss and are not suitable for every person. Only risk capital you can afford to lose.
The levels this script draws — triggers, stops and targets — are illustrations of a rule set, not instructions. Stop levels in particular are decision references, not protection: a resting order fills at whatever an opening gap provides, and an ATR buffer does not change that.
The indicator has not been optimised for any instrument, timeframe or market condition, and no backtest, win rate or performance figure is claimed or implied. The setup status readout records what happened to each drawn setup on the chart; it is a description, not a track record. Any settings shown are defaults for illustration, not recommendations.
You are solely responsible for your own trading decisions and their outcomes. Test any tool independently on your own instruments and timeframes, and consult a licensed financial professional before risking capital.
by Sreeni
What it does
Combines Bollinger Bands with Strat-style bar classification, multi-timeframe regime context, pre-computed trade levels, and the context a swing trader needs to judge a breakout: volume, structure in the way, and strength relative to the market. A two-candle pattern is never read in isolation.
Most inside-bar indicators mark the pattern and stop there. This one answers the questions that come after: what are the higher timeframes doing, what would the regime become if this bar breaks, where is the trigger, where does the stop go, how wide is the risk relative to normal range, is there a prior high in the way before the first target, and did the break happen on real participation.
Bar classification
Every bar is labelled against the prior bar on the same timeframe:
1 — Inside bar. Range contained within the prior bar. Compression.
2u / 2d — Directional. One side of the prior bar broken.
3 — Outside bar. Both sides broken. Expansion.
Inside bars are coloured and labelled "IB", outside bars "OB". A 3 followed by a 1 — maximum expansion into maximum compression — is highlighted across both candles.
An option controls whether a bar that merely equals the prior high or low counts as having broken that side. The default treats equality as non-breaking, which catches inside bars that a strict greater-than test misses. The same rule is applied to the chart and to every row of the regime table, so the two never disagree about the same bar.
Multi-timeframe regime table
Four configurable timeframes (Monthly / Weekly / Daily / 60m by default), each showing:
Scenario label (1 / 2u / 2d / 3)
Bar colour (close vs open)
In Force state — whether the close has actually cleared the prior bar's high or low, rather than merely drifting inside it
The row matching the chart timeframe is marked. A timeframe below the chart cannot be read from chart bars, so it is shown as n/a and left out of the aggregates rather than shown as a meaningless number.
Then the aggregates:
FTFC — do all readable timeframes agree in colour; when mixed, how many are green and how many red
MTF In Force — how many have genuinely broken prior structure, split into bull / bear / equilibrium so that "3 of 4 committed" cannot hide two bulls and a bear
Regime grade — A (full alignment) through N (standby / chop):
A: colour agreement and In Force in the same direction on every readable timeframe
B: colour agreement on all, but at least one timeframe still in equilibrium
C: all but one agree in colour, and the two highest timeframes are among them
D: anything more conflicted than C
N: the decision timeframe is an inside bar, or the two highest timeframes are opposite colours
If break — the grade the regime would have if the current chart bar broke up, and if it broke down. This is computed by substituting a 2u / 2d reading for the chart timeframe's row and re-running the grade. It tells you which side the higher timeframes support before the break happens. Shown only when the chart timeframe is one of the four table rows.
Agreement and commitment are deliberately kept separate. An instrument can be green on all four timeframes while never clearing a prior high; that is drift, not a breakout, and the table shows the difference.
On repainting: by default every higher-timeframe value comes from the last closed bar on that timeframe, so nothing in the table repaints. The offset is applied only to timeframes above the chart; a row equal to the chart timeframe uses the current bar, which is already complete at the close. A toggle switches to the live forming bar if you prefer current-but-provisional readings. The table footer states which mode is active.
Trigger levels, breaks and setup status
When an inside bar forms, the script projects:
Trigger lines at the bar's high and low, extending right until one is taken out. The pattern is the setup; the break is the event.
Stop levels, both directions, dashed until a break resolves which one applies.
R-multiple targets (default 1R / 2R / 3R) projected from the trigger once a break occurs.
Position size for your stated per-trade risk.
What counts as a break. By default the bar must close beyond the trigger on a completed bar — the same test the table uses for In Force. A wick through the level that closes back inside is not a break; it is usually the opposite. A "Wick" mode is available for traders who enter on the touch, evaluated live.
If a single bar takes out both sides of the inside bar (a 1-3), the direction is decided by its close. If it closes back inside the range, nothing has resolved and the setup keeps watching.
With consecutive inside bars, the triggers can re-anchor to each new narrower bar (default) or stay on the first bar of the run until its outer range breaks.
Setup status. After a break the levels stay on screen and the script keeps tracking the setup for a configurable number of bars: the status row reads Watching → Long / Short active → T1 / T2 / T3 hit, or Failed if the bar closes back inside the inside-bar range before any target is reached, or Stopped if the stop level trades. Bars since the break and the running R (distance from entry in units of initial risk) are shown alongside.
Two stop methods:
Structural + ATR buffer (default) — the stop sits beyond the opposite side of the inside bar, pushed out by a fraction of ATR. The level has a thesis behind it: if price re-enters the range, the setup is invalidated regardless of what volatility says. The ATR buffer pushes it past the wick where obvious stops sit.
ATR from trigger — a fixed ATR distance from the entry level. Simpler and uniform, but it can land inside the bar's own range, where normal movement takes you out.
ATR is frozen at the signal bar and held for the life of the setup. A level that recalculates every bar drifts, and a drifting stop is not a stop.
ATR is a simple average of true range over a configurable length (default 5), read from a configurable timeframe, defaulting to daily. A swing stop should respect the instrument's daily range even when the pattern is found intraday. If the chart timeframe is higher than the ATR timeframe, the chart timeframe is used instead, so a weekly inside bar is measured against weekly ranges rather than being rejected for being wider than a day.
Risk filter
Structural risk is expressed as a multiple of ATR and shown in the table. Setups above your threshold (default 1.5x ATR) are rejected outright — no lines, no alerts. When the stop is that far away, position size shrinks until the trade stops being worth the slot.
Most of the value here is in the setups that never get drawn.
Setup table (optional, off by default)
A second table carries the context around the setup:
Distance to trigger from the current close, in ATR and percent, both directions — whether to be watching tonight or next week.
Inside-bar context — what preceded the inside bar decides what each break means. After a 2d, an upside break is a 2-1-2 reversal and a downside break is continuation; after a 2u the reverse; after a 3 it is a 3-1 resolving.
Structure in the way — the nearest prior pivot high above the trigger and pivot low below it, each expressed as a distance in R, plus the prior completed bar's high / low on the second table timeframe (weekly by default). If the nearest structure sits under a configurable distance (default 1R), the row flags "into structure": the first obstacle arrives before the first target. Prior pivots are treated as targets, not support or resistance — they are where the last group of traders was trapped and where the move tends to travel before deciding. A pivot is defined by a configurable number of bars either side (default 5 / 5), so it is confirmed and never repaints, and is always that many bars stale.
Volume — ratio to the prior N-bar average (default 20), for the inside bar, the bar before it, and the current bar. Tiers: Low under 0.7x, Normal, High above 1.5x, Climax above 2.5x (all configurable). A live intraday bar carries partial volume, so its ratio is projected by the fraction of the session elapsed and marked "proj". Hidden on instruments that report no volume.
Break bar — the break bar's volume ratio, its range as a multiple of ATR, and where it closed within its own range. A wide-range, high-volume bar closing near its extreme is a different event from a narrow churn bar closing mid-range.
Relative strength versus a configurable benchmark (default SPY): the instrument's return over two lookbacks (default 20 and 60 bars) minus the benchmark's, on the chart timeframe. Positive means it outperformed. The benchmark's own bar state is shown, and at the moment of a break the script records whether the benchmark broke too or was itself an inside bar — a break that happens without the index is noted as such. Set the benchmark to a sector ETF if that is the comparison that matters for your names.
Alerts
Nine conditions: inside bar, outside bar, 3-1 pattern, the two trigger breaks, break on elevated volume, failed break, stop hit, and target 1 hit.
Breaks can be gated so they only fire when the direction agrees with the higher-timeframe leaning, and optionally when relative strength agrees too, which cuts alert volume sharply. Break alerts respect the close / wick setting.
A dynamic alert() is also included, carrying the actual trigger price, stop, risk per share, break-bar volume, regime grade and relative strength in the message. Select "Any alert() function call" when creating it.
Settings worth knowing
Break confirmation (default Close). Change it to Wick only if you know why.
Signal only on closed bars (default on). With it off, a live inside bar can become an outside bar before the close and labels shift accordingly.
Text sizes — table body, table headers, IB/OB labels, break arrows and level prices each have independent size controls, Tiny through Huge.
Timeframes are inputs, not hardcoded. Swing traders working a 4H execution timeframe can set W/D/4H/1H, and the "If break" row then reads the 4H row.
Risk per trade drives the position-size column. Set it to your actual figure or the numbers mean nothing.
Price labels on the chart are off by default; every level is in the tables.
How to use it
Read the regime table first. Grade N or D means stand aside regardless of what the candles look like. Then read "If break": if only one side leads to an A or B, that is the side worth waiting for.
Find the inside bar. It is a watchlist item, not an entry. Open the setup table and check what preceded it and whether there is structure inside 1R.
Wait for the close beyond the trigger line. That is the only permission.
Check the break bar: was it on volume, was it wide, did it close near its extreme, did the index break with it or not.
Check risk in ATR terms before sizing. If it is wide, it is wide — reduce or skip.
The stop level is where the premise fails. If you are moving it, you are no longer trading the setup. A failed break — a close back inside the range — is the setup telling you it was wrong.
Known limitations
Markers are drawn as label objects so their size can be configured; TradingView caps these at 500 per chart, so the oldest drop off as you scroll back. Bar colouring and background highlights are unaffected.
The regime grade flags a decision-timeframe inside bar as standby. That is intentional — the decision timeframe has not committed yet — and the "If break" row exists precisely to show what happens once it does.
Stop levels are decision levels. A resting order fills at whatever an opening gap gives you, and no ATR buffer protects against that.
Relative strength on an intraday chart compares bars that may not align exactly if the benchmark trades different session hours. On daily and above this does not arise.
Volume projection for a live bar assumes volume arrives evenly through the session, which it does not; treat the projected figure as a rough gauge.
Credit
Bar classification follows the scenario framework popularised by Rob Smith (TheStrat). The Bollinger Band, ATR and pivot calculations are standard. Everything else — the regime grading, conditional grading, trigger projection, setup state tracking, ATR stop logic, risk filter, sizing, volume tiers and relative-strength readout — is original work in this script.
Author: Sreeni — @t2make
Educational tool — not trading advice
This indicator is published for learning and research purposes only.
It describes the structure of past and current price action using a fixed, published rule set. It does not predict future price movement, does not generate buy or sell recommendations, and is not investment, financial, legal or tax advice. Nothing here is a solicitation to trade any instrument.
No representation is made that any account will or is likely to achieve profits or losses similar to anything shown or described. Past chart behaviour does not indicate future results. Trading and investing involve substantial risk of loss and are not suitable for every person. Only risk capital you can afford to lose.
The levels this script draws — triggers, stops and targets — are illustrations of a rule set, not instructions. Stop levels in particular are decision references, not protection: a resting order fills at whatever an opening gap provides, and an ATR buffer does not change that.
The indicator has not been optimised for any instrument, timeframe or market condition, and no backtest, win rate or performance figure is claimed or implied. The setup status readout records what happened to each drawn setup on the chart; it is a description, not a track record. Any settings shown are defaults for illustration, not recommendations.
You are solely responsible for your own trading decisions and their outcomes. Test any tool independently on your own instruments and timeframes, and consult a licensed financial professional before risking capital.

Clause de non-responsabilité
Les informations et publications ne sont pas destinées à être, et ne constituent pas, des conseils ou recommandations financiers, d'investissement, de trading ou autres fournis ou approuvés par TradingView. Pour en savoir plus, consultez les Conditions d'utilisation.
Clause de non-responsabilité
Les informations et publications ne sont pas destinées à être, et ne constituent pas, des conseils ou recommandations financiers, d'investissement, de trading ou autres fournis ou approuvés par TradingView. Pour en savoir plus, consultez les Conditions d'utilisation.