Trendlines with Breakouts, Touches & Hold Rate [LunqFX]
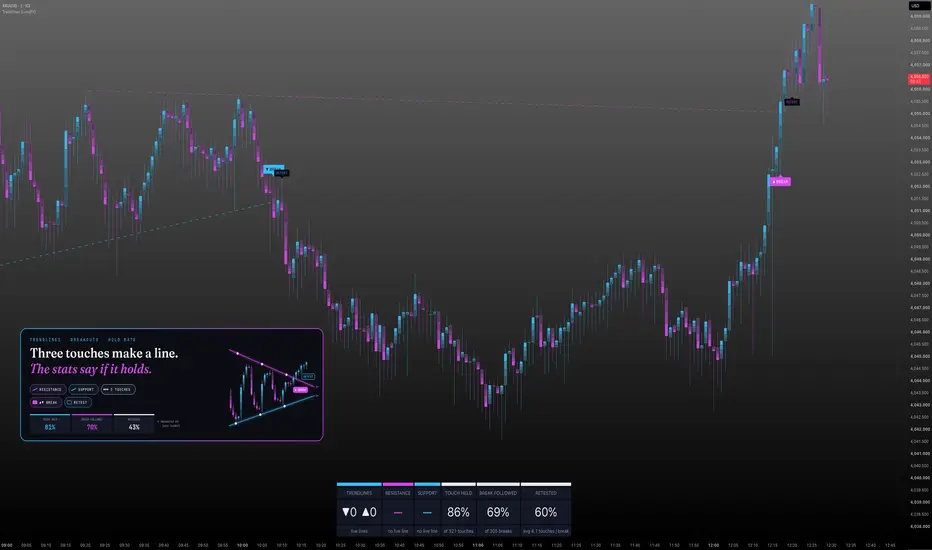
Trendlines draws automatic trendlines through confirmed swing highs and lows, keeps only the lines price has not closed through, counts every touch, and marks each breakout and retest. A scoreboard under the chart then answers the questions every trendline trader asks: on this symbol, how often did a touch hold, how often did a break follow through, and how often did price come back to retest the broken line?
Most auto trendline indicators connect two swings and stop there. Two points can always be joined, so the chart fills with lines that were never really tested. This one only draws a line once it has three touches (adjustable), picks the anchor with the most touches instead of the nearest one, removes near-duplicate lines, and measures what the lines did afterwards — so you can see whether trendlines are worth trading on the market in front of you, and not just where they are.
❶ HOW THE LINES ARE BUILT ① Swings — swing highs and lows are confirmed pivots (Swing length bars on each side). ② Anchors — every new swing is paired with up to six earlier swings on the same side. A resistance line must fall from one high to a lower high; a support line must rise from one low to a higher low. ③ Validation — a pair is kept only if no candle has closed through the line since its first anchor (with a small ATR tolerance). ④ Touches — the swings that sit on the line count as touches. The pair with the most touches wins, and it is drawn only when it reaches the minimum (3 by default). ⑤ No clutter — a line that ends at almost the same price as a live line, or fans out of the same anchor with fewer touches, is not drawn. Each side keeps a set number of live lines; the oldest one makes way for a new one.
❷ WHAT YOU SEE ▸ Resistance lines in magenta, support lines in sky blue, each with a soft glow and extended a few bars into the future ▸ A touch counter at the end of every line ("3 touches", "4 touches"…) that grows as new touches come in ▸ ▲ BREAK / ▼ BREAK — a candle closed beyond the line by the break buffer. The line turns dashed and fades ▸ RETEST — price came back to the broken line and held on the break side
❸ THE SCOREBOARD Six tiles across the bottom of the chart: ▸ TRENDLINES — live resistance and support lines ▸ RESISTANCE · SUPPORT — distance to the nearest line in ATR, with its number of touches ▸ TOUCH HELD — the share of touches after which price moved away from the line by the set ATR before closing through it ▸ BREAK FOLLOWED — the share of breaks after which price ran the set ATR beyond the line before closing back ▸ RETESTED — the share of breaks that were retested, and the average number of touches a line had before it broke Both thresholds — the move in ATR and the number of bars allowed for it — are set in Measurement.
❹ HOW TO USE IT
Read the nearest resistance and support in the scoreboard: how far price is from each line and how many times each has been touched.
Check the track record before relying on a line: a high TOUCH HELD favours trading bounces from the line; a high BREAK FOLLOWED and RETESTED favours trading breaks and their retests on this symbol.
A break with a retest that holds is the classic trendline breakout setup; use your own entry and risk rules.
Higher Swing length draws fewer, longer lines for swing trading; lower values suit scalping.
Works on forex, gold (XAUUSD), indices, crypto and stocks, on any timeframe.
❺ SETTINGS Trendlines ▸ Swing length · Active lines per side · Swings searched for an anchor ▸ Min. touches to draw a line — 3 by default; 2 shows every two-swing line ▸ Touch tolerance (× ATR) · Break buffer (× ATR) · Min. bars between anchors Measurement ▸ A touch holds / a break follows through after (× ATR) — 1 ATR by default ▸ Bars to judge a touch or a break — 20 by default Drawing ▸ Line glow · Extend lines right · Broken lines kept · Break and retest labels · Touch count on each line ▸ Label size — Small, Normal, Large (default) or Huge Scoreboard ▸ Show · position (bottom centre by default, top centre, bottom right, top right) · text size Alerts ▸ Trendline break · New trendline · Trendline touch Visuals ▸ Neon candles — sky blue rising, magenta falling. Off = your own chart candles. ▸ Glow candles — each body brightens towards the close. Off = flat bodies.
❻ ALERTS ▸ Price broke above a descending trendline ▸ Price broke below an ascending trendline ▸ New trendline drawn (off by default) ▸ Trendline touched (off by default) Create the alert with "Any alert() function call", or use the alert conditions for breaks and touches.
❼ NON-REPAINTING Lines are anchored to confirmed pivots, so a new line appears "Swing length" bars after its last anchor formed — never before. Touches, breaks and retests are decided on closed bars, and nothing is redrawn back in time. The script does not use request.security or lookahead.
LIMITATIONS ▸ Swing confirmation delays every new line by the swing length. ▸ Trendlines are subjective; this script draws them with fixed rules (anchors, tolerance, minimum touches). Other traders may draw different lines on the same chart. ▸ A limited number of live lines is kept per side, so an older line can be removed while still valid. ▸ The track record covers only the history loaded on your chart and depends on the thresholds you choose; a larger move threshold lowers the percentages. Past rates are not a forecast. ▸ The script gives structure and statistics, not entries: it has no stop loss, targets or position sizing. Combine it with your own entry rules and risk management.
This script is for educational purposes only and is not financial advice. Trading involves risk.
Most auto trendline indicators connect two swings and stop there. Two points can always be joined, so the chart fills with lines that were never really tested. This one only draws a line once it has three touches (adjustable), picks the anchor with the most touches instead of the nearest one, removes near-duplicate lines, and measures what the lines did afterwards — so you can see whether trendlines are worth trading on the market in front of you, and not just where they are.
❶ HOW THE LINES ARE BUILT ① Swings — swing highs and lows are confirmed pivots (Swing length bars on each side). ② Anchors — every new swing is paired with up to six earlier swings on the same side. A resistance line must fall from one high to a lower high; a support line must rise from one low to a higher low. ③ Validation — a pair is kept only if no candle has closed through the line since its first anchor (with a small ATR tolerance). ④ Touches — the swings that sit on the line count as touches. The pair with the most touches wins, and it is drawn only when it reaches the minimum (3 by default). ⑤ No clutter — a line that ends at almost the same price as a live line, or fans out of the same anchor with fewer touches, is not drawn. Each side keeps a set number of live lines; the oldest one makes way for a new one.
❷ WHAT YOU SEE ▸ Resistance lines in magenta, support lines in sky blue, each with a soft glow and extended a few bars into the future ▸ A touch counter at the end of every line ("3 touches", "4 touches"…) that grows as new touches come in ▸ ▲ BREAK / ▼ BREAK — a candle closed beyond the line by the break buffer. The line turns dashed and fades ▸ RETEST — price came back to the broken line and held on the break side
❸ THE SCOREBOARD Six tiles across the bottom of the chart: ▸ TRENDLINES — live resistance and support lines ▸ RESISTANCE · SUPPORT — distance to the nearest line in ATR, with its number of touches ▸ TOUCH HELD — the share of touches after which price moved away from the line by the set ATR before closing through it ▸ BREAK FOLLOWED — the share of breaks after which price ran the set ATR beyond the line before closing back ▸ RETESTED — the share of breaks that were retested, and the average number of touches a line had before it broke Both thresholds — the move in ATR and the number of bars allowed for it — are set in Measurement.
❹ HOW TO USE IT
Read the nearest resistance and support in the scoreboard: how far price is from each line and how many times each has been touched.
Check the track record before relying on a line: a high TOUCH HELD favours trading bounces from the line; a high BREAK FOLLOWED and RETESTED favours trading breaks and their retests on this symbol.
A break with a retest that holds is the classic trendline breakout setup; use your own entry and risk rules.
Higher Swing length draws fewer, longer lines for swing trading; lower values suit scalping.
Works on forex, gold (XAUUSD), indices, crypto and stocks, on any timeframe.
❺ SETTINGS Trendlines ▸ Swing length · Active lines per side · Swings searched for an anchor ▸ Min. touches to draw a line — 3 by default; 2 shows every two-swing line ▸ Touch tolerance (× ATR) · Break buffer (× ATR) · Min. bars between anchors Measurement ▸ A touch holds / a break follows through after (× ATR) — 1 ATR by default ▸ Bars to judge a touch or a break — 20 by default Drawing ▸ Line glow · Extend lines right · Broken lines kept · Break and retest labels · Touch count on each line ▸ Label size — Small, Normal, Large (default) or Huge Scoreboard ▸ Show · position (bottom centre by default, top centre, bottom right, top right) · text size Alerts ▸ Trendline break · New trendline · Trendline touch Visuals ▸ Neon candles — sky blue rising, magenta falling. Off = your own chart candles. ▸ Glow candles — each body brightens towards the close. Off = flat bodies.
❻ ALERTS ▸ Price broke above a descending trendline ▸ Price broke below an ascending trendline ▸ New trendline drawn (off by default) ▸ Trendline touched (off by default) Create the alert with "Any alert() function call", or use the alert conditions for breaks and touches.
❼ NON-REPAINTING Lines are anchored to confirmed pivots, so a new line appears "Swing length" bars after its last anchor formed — never before. Touches, breaks and retests are decided on closed bars, and nothing is redrawn back in time. The script does not use request.security or lookahead.
LIMITATIONS ▸ Swing confirmation delays every new line by the swing length. ▸ Trendlines are subjective; this script draws them with fixed rules (anchors, tolerance, minimum touches). Other traders may draw different lines on the same chart. ▸ A limited number of live lines is kept per side, so an older line can be removed while still valid. ▸ The track record covers only the history loaded on your chart and depends on the thresholds you choose; a larger move threshold lowers the percentages. Past rates are not a forecast. ▸ The script gives structure and statistics, not entries: it has no stop loss, targets or position sizing. Combine it with your own entry rules and risk management.
This script is for educational purposes only and is not financial advice. Trading involves risk.

Trade setups with clear entry, stop, target and risk logic. Built for traders who want structure, not guessing.
💬 t.me/lunqfx
🌐 lunqfx.com/premium
💬 t.me/lunqfx
🌐 lunqfx.com/premium
Clause de non-responsabilité
Les informations et publications ne sont pas destinées à être, et ne constituent pas, des conseils ou recommandations financiers, d'investissement, de trading ou autres fournis ou approuvés par TradingView. Pour en savoir plus, consultez les Conditions d'utilisation.
Trade setups with clear entry, stop, target and risk logic. Built for traders who want structure, not guessing.
💬 t.me/lunqfx
🌐 lunqfx.com/premium
💬 t.me/lunqfx
🌐 lunqfx.com/premium
Clause de non-responsabilité
Les informations et publications ne sont pas destinées à être, et ne constituent pas, des conseils ou recommandations financiers, d'investissement, de trading ou autres fournis ou approuvés par TradingView. Pour en savoir plus, consultez les Conditions d'utilisation.