OPEN-SOURCE SCRIPT
Intermarket Flow Oscillator
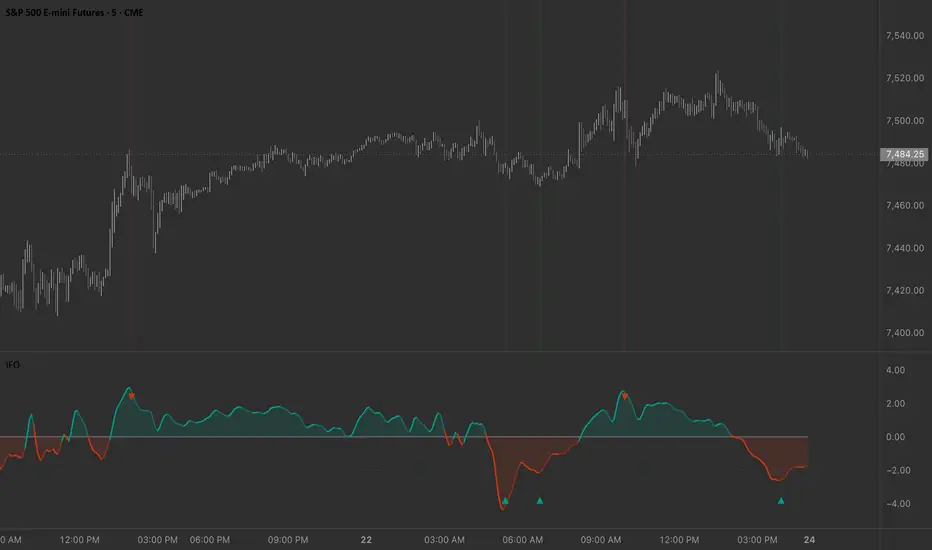
Advanced Macro Regime Tracking & Apex Reversal Detection
What is the Intermarket Flow Oscillator (IFO)?
The Intermarket Flow Oscillator (IFO) is a quantitative momentum tool designed to track capital rotation between risk-on assets (growth, equities) and risk-off assets (defensives, bonds, safe havens). By utilizing advanced statistical normalization and John Ehlers' digital signal processing, the IFO visualizes structural market regimes and pinpoints high-probability exhaustion reversals.
Whether you are trading swing setups on the daily chart or monitoring intraday capital flows, the IFO acts as a macro compass to keep you on the right side of institutional money.
The Mathematical Engine
Traditional spread indicators suffer from noise and asymmetric scaling. The IFO solves this using a two-step quantitative process:
How to Read the Signals
Practical Trading Application: Sector Rotation (XLK vs. XLP)
While the default script pairs S&P 500 Futures (ES) against 10-Year Treasuries (ZN), the true power of the IFO shines in sector rotation.
The Setup: Set the Risk Asset to XLK (Technology) and the Safe Haven to XLP (Consumer Staples).
The Logic: XLK represents high-beta, duration-sensitive growth (Apple, Microsoft, Nvidia). XLP represents inelastic consumer demand (Procter & Gamble, Walmart). This spread is the ultimate risk-on/risk-off gauge.
Key Features & Customization
What is the Intermarket Flow Oscillator (IFO)?
The Intermarket Flow Oscillator (IFO) is a quantitative momentum tool designed to track capital rotation between risk-on assets (growth, equities) and risk-off assets (defensives, bonds, safe havens). By utilizing advanced statistical normalization and John Ehlers' digital signal processing, the IFO visualizes structural market regimes and pinpoints high-probability exhaustion reversals.
Whether you are trading swing setups on the daily chart or monitoring intraday capital flows, the IFO acts as a macro compass to keep you on the right side of institutional money.
The Mathematical Engine
Traditional spread indicators suffer from noise and asymmetric scaling. The IFO solves this using a two-step quantitative process:
- Z-Score Normalization: The script calculates the natural log ratio of a Risk Asset versus a Safe Haven asset, then applies a rolling Z-Score. This transforms the intermarket spread into a stationary stochastic process, making standard deviation thresholds mathematically reliable.
- John Ehlers' 2-Pole SuperSmoother: To eliminate high-frequency market noise without introducing the severe phase lag typical of moving averages, the Z-Score is passed through an advanced DSP filter.
How to Read the Signals
- Trend Shifts & Structural Regimes (The Zero-Line)
The smoothed oscillator crossing the zero equilibrium line indicates a macro shift in capital allocation.
Green Cloud (IFO > 0): Structural Risk-On Regime. Institutions are accumulating risk/growth. Traders should look for long momentum setups and favor high-beta assets.
Red Cloud (IFO < 0): Structural Risk-Off Regime. Capital is fleeing to safety. Traders should focus on cash preservation, defensive value, or short setups. - Apex Mean-Reversion Turns (▲ and ▼)
The script calculates the first derivative (Velocity) of the smoothed capital flow. When the oscillator reaches extreme statistical exhaustion thresholds (default ±1.5 standard deviations) and the velocity flips, the IFO prints a high-contrast triangle.
Bullish Apex (▲): Occurs deep in negative territory (panic/capitulation). Represents a mathematically optimal exhaustion point where selling pressure is dying. Excellent for buying the bottom in growth stocks.
Bearish Apex (▼): Occurs high in positive territory (euphoria). Represents exhaustion in risk-taking and serves as an early warning to take profits or look for short entries.
Practical Trading Application: Sector Rotation (XLK vs. XLP)
While the default script pairs S&P 500 Futures (ES) against 10-Year Treasuries (ZN), the true power of the IFO shines in sector rotation.
The Setup: Set the Risk Asset to XLK (Technology) and the Safe Haven to XLP (Consumer Staples).
The Logic: XLK represents high-beta, duration-sensitive growth (Apple, Microsoft, Nvidia). XLP represents inelastic consumer demand (Procter & Gamble, Walmart). This spread is the ultimate risk-on/risk-off gauge.
Key Features & Customization
- Customizable Pairs: Fully adjustable inputs to test different macro pairs (e.g., BTC vs. Gold, BTCUSDT.P vs. USDT, Discretionary vs. Utilities, High Yield Bonds vs. Treasuries).
- Dynamic Coloring: The oscillator line shifts between bright/faded colors based on momentum velocity, giving you a visual cue before a crossover even happens.
Script open-source
Dans l'esprit TradingView, le créateur de ce script l'a rendu open source afin que les traders puissent examiner et vérifier ses fonctionnalités. Bravo à l'auteur! Bien que vous puissiez l'utiliser gratuitement, n'oubliez pas que la republication du code est soumise à nos Règles.

Clause de non-responsabilité
Les informations et publications ne sont pas destinées à être, et ne constituent pas, des conseils ou recommandations financiers, d'investissement, de trading ou autres fournis ou approuvés par TradingView. Pour en savoir plus, consultez les Conditions d'utilisation.
Script open-source
Dans l'esprit TradingView, le créateur de ce script l'a rendu open source afin que les traders puissent examiner et vérifier ses fonctionnalités. Bravo à l'auteur! Bien que vous puissiez l'utiliser gratuitement, n'oubliez pas que la republication du code est soumise à nos Règles.
Clause de non-responsabilité
Les informations et publications ne sont pas destinées à être, et ne constituent pas, des conseils ou recommandations financiers, d'investissement, de trading ou autres fournis ou approuvés par TradingView. Pour en savoir plus, consultez les Conditions d'utilisation.