OPEN-SOURCE SCRIPT
Wave Oscillator
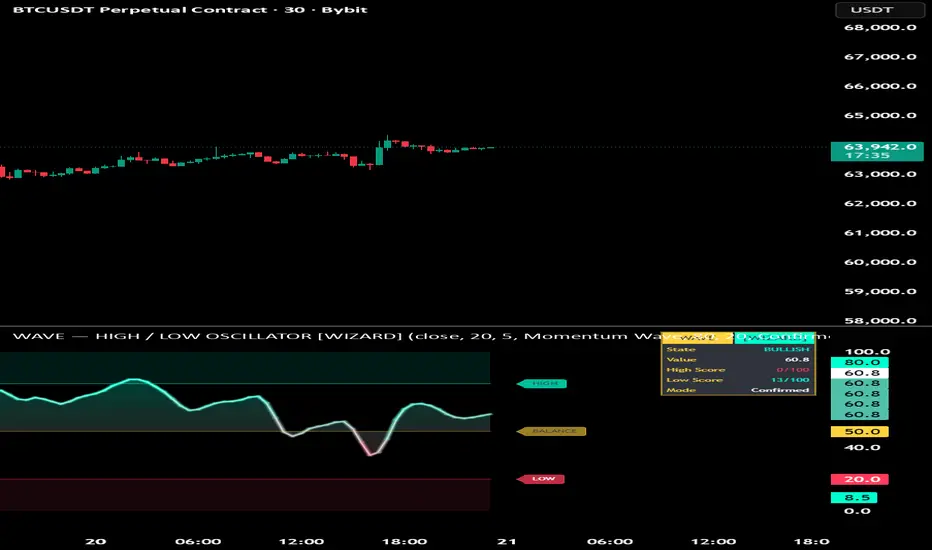
wave high low detector pro
wave high low detector is a bounded oscillator designed to help identify potential local high and low areas using momentum, rsi behavior, pivot confirmation, candle rejection, divergence, atr exhaustion, structure breaks, cooldown logic and quality scoring.
the oscillator moves between 0 and 100.
a value near 100 means price is trading close to the upper part of its recent range or showing strong upside momentum.
a value near 0 means price is trading close to the lower part of its recent range or showing strong downside momentum.
the script does not predict the future and does not guarantee market tops or bottoms. it is a technical analysis tool that marks possible early and confirmed high or low references. every signal should be confirmed with price action, market structure, volume, trend context and risk management.
main idea
the indicator separates high and low detection into two signal types:
early high and early low
confirmed high and confirmed low
early signals are faster and more reactive. they appear when the oscillator leaves an extreme zone and the selected filters agree.
confirmed signals are slower but more selective. they use pivot confirmation and additional context to validate a stronger high or low reference.
this design allows the trader to choose between speed and confirmation.
what the indicator shows
wave oscillator
high zone
low zone
balance zone
early high markers
early low markers
confirmed high markers
confirmed low markers
quality score labels
bull and bear gradient fill
optional glow
right-side zone labels
dashboard with state, value, score and mode
separate alerts for early and confirmed signals
how high and low detection works
an early high appears when the oscillator leaves the upper zone after being stretched upward.
an early low appears when the oscillator leaves the lower zone after being stretched downward.
a confirmed high appears only when a pivot high is confirmed and the score is strong enough.
a confirmed low appears only when a pivot low is confirmed and the score is strong enough.
confirmed signals are placed back on the pivot location, so they naturally appear with a delay. this is normal because pivots need future bars to confirm the local high or low.
quality score
the score rates the quality of a potential high or low from 0 to 100.
the score can include:
extreme oscillator condition
super extreme oscillator condition
oscillator slope reversal
wick rejection
atr exhaustion
divergence
structure break
pivot confirmation
a higher score means more conditions agree. a lower score means the setup is weaker or less complete.
the score is not a trade signal by itself. it is only a filter that helps compare the quality of different high and low references.
input guide
engine
source
selects the price source used by the rsi engine.
common choices are close, open, high, low, hl2, hlc3 or ohlc4.
length sensitivity
controls how many bars are used by the oscillator engine.
lower values make the wave faster and more reactive.
higher values make the wave smoother and slower.
smoothing
smooths the oscillator.
higher values reduce noise but add delay.
lower values react faster but may produce more signals.
engine
selects the oscillator calculation method.
momentum wave
uses a stochastic-style high and low range calculation. this is the most direct mode for high and low detection.
rsi
uses a smoothed rsi. this mode reads momentum exhaustion rather than pure range position.
blend
combines rsi and range position. this gives a balanced reading between momentum and high or low range behavior.
levels
overbought high zone
sets the upper zone where price is considered stretched toward the high area.
default logic usually works around 80.
oversold low zone
sets the lower zone where price is considered stretched toward the low area.
default logic usually works around 20.
show midline
shows or hides the 50 balance line.
above 50, the oscillator is generally stronger.
below 50, the oscillator is generally weaker.
high low detector
detection mode
controls the signal strictness.
fast
more reactive. it allows earlier signals with fewer confirmations.
balanced
uses a middle approach between speed and confirmation.
confirmed
stricter and slower. it requires stronger confirmation and higher score quality.
show early high low
shows or hides early high and early low markers.
show confirmed high low
shows or hides confirmed high and confirmed low markers.
balanced minimum score
sets the minimum score used in balanced mode.
higher values reduce signals.
lower values increase signals.
pivot left bars
sets how many bars to the left are used to confirm a pivot.
higher values make pivots more important but slower.
pivot right bars
sets how many bars to the right are required to confirm a pivot.
higher values make confirmed signals more reliable but delayed.
cooldown between signals
sets the minimum number of bars between repeated signals of the same type.
this helps reduce signal spam.
show quality score labels
shows or hides score labels near early and confirmed markers.
optional filters
use divergence in score
adds divergence logic to the quality score.
bearish divergence can strengthen a confirmed high.
bullish divergence can strengthen a confirmed low.
wick rejection filter
requires a rejection wick before accepting signals.
for highs, the script looks for upper wick rejection.
for lows, the script looks for lower wick rejection.
min wick percent of candle
sets the minimum wick size needed for the wick rejection filter.
higher values make the filter stricter.
lower values allow more signals.
atr exhaustion filter
requires price to be extended away from a moving average by an atr-based distance.
this helps focus on stronger exhaustion moves.
atr length
sets the atr calculation length.
atr exhaustion multiplier
sets how far price must extend from the average before the atr exhaustion filter confirms.
structure break filter
requires a short structure break to confirm the signal.
for highs, price should break below recent structure.
for lows, price should break above recent structure.
structure break lookback
sets how many bars are used to define the recent structure level.
visuals
glow
turns the glow effect around the wave on or off.
glow intensity
controls the strength of the glow.
bull bear gradient fill
fills the area between the wave and the midline with a bull or bear gradient.
fill transparency
controls how visible the gradient fill is.
higher transparency makes the fill lighter.
lower transparency makes the fill stronger.
tint high low zones
adds a faint background tint to the high and low areas.
color theme
selects the visual color style.
wizard
default bright cyan and red style.
ice
cool blue theme.
inferno
warm orange and red theme.
toxic
green and purple style.
markers
show high low markers
turns all markers on or off.
marker labels
selects the marker text style.
high low
uses early high, early low, confirmed high and confirmed low style labels.
buy sell
uses early buy, early sell, confirmed buy and confirmed sell style labels.
these labels are visual references only, not automatic entries.
show zone labels right
shows high, low and balance labels on the right side of the oscillator.
dashboard
show dashboard
shows or hides the dashboard.
position
selects the dashboard location.
the dashboard displays:
current state
current oscillator value
high score
low score
detection mode
signal types
early high
an early high appears when the wave leaves the high zone and the high score passes the selected requirements.
this means upside pressure may be weakening.
it is not a guaranteed top.
early low
an early low appears when the wave leaves the low zone and the low score passes the selected requirements.
this means downside pressure may be weakening.
it is not a guaranteed bottom.
confirmed high
a confirmed high appears when a pivot high is confirmed and the score is strong enough.
this signal is more selective but appears later.
confirmed low
a confirmed low appears when a pivot low is confirmed and the score is strong enough.
this signal is more selective but appears later.
how to use the alerts
the script includes separate alert conditions:
early high
early low
confirmed high
confirmed low
any early high or low
any confirmed high or low
for fast monitoring, use early alerts.
for cleaner monitoring, use confirmed alerts.
for fewer alerts, use only any confirmed high or low.
recommended anti-spam setup:
use confirmed signals only
increase cooldown between signals
use balanced or confirmed mode
keep pivot right bars at 3 or higher
increase the minimum score if there are too many signals
recommended beginner alert setup:
start with any confirmed high or low
use balanced mode
set cooldown between signals to 8 or more
keep score labels enabled
avoid using every alert condition at the same time
beginner tutorial
step 1: start with balanced mode
balanced mode is the best starting point because it avoids being too fast or too strict.
step 2: keep the default high and low zones
use 80 for the high zone and 20 for the low zone.
this gives a clean first reading.
step 3: watch the wave position
when the wave is above 80, price is stretched toward the high area.
when the wave is below 20, price is stretched toward the low area.
when the wave is around 50, the market is more balanced.
step 4: understand early signals
early signals are warnings.
early high means a possible local top area may be forming.
early low means a possible local bottom area may be forming.
do not enter a trade only because an early signal appears.
step 5: understand confirmed signals
confirmed signals are more selective.
confirmed high means a pivot high has been validated.
confirmed low means a pivot low has been validated.
these signals are slower because the script waits for confirmation.
step 6: read the score
a score near 50 is weaker.
a score near 65 is more acceptable.
a score above 75 is stronger.
a score above 85 means several filters agree.
step 7: confirm on the price chart
before using any signal, check:
trend direction
support and resistance
market structure
candle close
volume reaction
risk to reward
stop loss location
step 8: avoid overloading the chart
do not turn on every filter at once at the beginning.
start with:
balanced mode
wick rejection filter on
divergence in score on
atr exhaustion filter off
structure break filter off
cooldown enabled
after understanding the tool, activate atr exhaustion or structure break if you want stricter signals.
example 1: early high
price pushes upward and the wave moves above the high zone.
then the wave crosses back below the high zone.
an early high appears.
this means the upward push may be losing strength.
a beginner should wait for price rejection or a lower high before considering a short idea.
example 2: confirmed high
price forms a local high.
a few bars later, the pivot is confirmed.
the indicator prints confirmed high at the pivot location.
this is a stronger reference than an early high, but it appears later.
example 3: early low
price drops and the wave moves below the low zone.
then the wave crosses back above the low zone.
an early low appears.
this means downside pressure may be weakening.
a beginner should wait for support reaction or a higher low before considering a long idea.
example 4: confirmed low
price forms a local low.
a few bars later, the pivot is confirmed.
the indicator prints confirmed low at the pivot location.
this is a stronger reference than an early low, but it appears later.
example 5: using cooldown
if the market is volatile, the wave can create several signals close together.
cooldown prevents repeated signals from appearing too often.
higher cooldown values create a cleaner chart.
lower cooldown values create more frequent signals.
best use cases
spotting potential local highs
spotting potential local lows
detecting exhaustion zones
finding momentum fade areas
confirming high and low references with pivots
filtering noisy oscillator signals
building alerts for reversal watchlists
supporting discretionary trading decisions
important notes
early signals are faster but less confirmed.
confirmed signals are more selective but delayed.
pivot-based confirmation cannot appear instantly.
score is a filter, not a prediction.
buy and sell labels are only visual naming options.
the indicator should be combined with price action, structure, volume and risk management.
risk note
this indicator is for technical analysis and educational market study only. it does not provide financial advice, investment advice or guaranteed trading signals. all signals, markers, scores and alerts are references that require independent confirmation and proper risk management.
wave high low detector is a bounded oscillator designed to help identify potential local high and low areas using momentum, rsi behavior, pivot confirmation, candle rejection, divergence, atr exhaustion, structure breaks, cooldown logic and quality scoring.
the oscillator moves between 0 and 100.
a value near 100 means price is trading close to the upper part of its recent range or showing strong upside momentum.
a value near 0 means price is trading close to the lower part of its recent range or showing strong downside momentum.
the script does not predict the future and does not guarantee market tops or bottoms. it is a technical analysis tool that marks possible early and confirmed high or low references. every signal should be confirmed with price action, market structure, volume, trend context and risk management.
main idea
the indicator separates high and low detection into two signal types:
early high and early low
confirmed high and confirmed low
early signals are faster and more reactive. they appear when the oscillator leaves an extreme zone and the selected filters agree.
confirmed signals are slower but more selective. they use pivot confirmation and additional context to validate a stronger high or low reference.
this design allows the trader to choose between speed and confirmation.
what the indicator shows
wave oscillator
high zone
low zone
balance zone
early high markers
early low markers
confirmed high markers
confirmed low markers
quality score labels
bull and bear gradient fill
optional glow
right-side zone labels
dashboard with state, value, score and mode
separate alerts for early and confirmed signals
how high and low detection works
an early high appears when the oscillator leaves the upper zone after being stretched upward.
an early low appears when the oscillator leaves the lower zone after being stretched downward.
a confirmed high appears only when a pivot high is confirmed and the score is strong enough.
a confirmed low appears only when a pivot low is confirmed and the score is strong enough.
confirmed signals are placed back on the pivot location, so they naturally appear with a delay. this is normal because pivots need future bars to confirm the local high or low.
quality score
the score rates the quality of a potential high or low from 0 to 100.
the score can include:
extreme oscillator condition
super extreme oscillator condition
oscillator slope reversal
wick rejection
atr exhaustion
divergence
structure break
pivot confirmation
a higher score means more conditions agree. a lower score means the setup is weaker or less complete.
the score is not a trade signal by itself. it is only a filter that helps compare the quality of different high and low references.
input guide
engine
source
selects the price source used by the rsi engine.
common choices are close, open, high, low, hl2, hlc3 or ohlc4.
length sensitivity
controls how many bars are used by the oscillator engine.
lower values make the wave faster and more reactive.
higher values make the wave smoother and slower.
smoothing
smooths the oscillator.
higher values reduce noise but add delay.
lower values react faster but may produce more signals.
engine
selects the oscillator calculation method.
momentum wave
uses a stochastic-style high and low range calculation. this is the most direct mode for high and low detection.
rsi
uses a smoothed rsi. this mode reads momentum exhaustion rather than pure range position.
blend
combines rsi and range position. this gives a balanced reading between momentum and high or low range behavior.
levels
overbought high zone
sets the upper zone where price is considered stretched toward the high area.
default logic usually works around 80.
oversold low zone
sets the lower zone where price is considered stretched toward the low area.
default logic usually works around 20.
show midline
shows or hides the 50 balance line.
above 50, the oscillator is generally stronger.
below 50, the oscillator is generally weaker.
high low detector
detection mode
controls the signal strictness.
fast
more reactive. it allows earlier signals with fewer confirmations.
balanced
uses a middle approach between speed and confirmation.
confirmed
stricter and slower. it requires stronger confirmation and higher score quality.
show early high low
shows or hides early high and early low markers.
show confirmed high low
shows or hides confirmed high and confirmed low markers.
balanced minimum score
sets the minimum score used in balanced mode.
higher values reduce signals.
lower values increase signals.
pivot left bars
sets how many bars to the left are used to confirm a pivot.
higher values make pivots more important but slower.
pivot right bars
sets how many bars to the right are required to confirm a pivot.
higher values make confirmed signals more reliable but delayed.
cooldown between signals
sets the minimum number of bars between repeated signals of the same type.
this helps reduce signal spam.
show quality score labels
shows or hides score labels near early and confirmed markers.
optional filters
use divergence in score
adds divergence logic to the quality score.
bearish divergence can strengthen a confirmed high.
bullish divergence can strengthen a confirmed low.
wick rejection filter
requires a rejection wick before accepting signals.
for highs, the script looks for upper wick rejection.
for lows, the script looks for lower wick rejection.
min wick percent of candle
sets the minimum wick size needed for the wick rejection filter.
higher values make the filter stricter.
lower values allow more signals.
atr exhaustion filter
requires price to be extended away from a moving average by an atr-based distance.
this helps focus on stronger exhaustion moves.
atr length
sets the atr calculation length.
atr exhaustion multiplier
sets how far price must extend from the average before the atr exhaustion filter confirms.
structure break filter
requires a short structure break to confirm the signal.
for highs, price should break below recent structure.
for lows, price should break above recent structure.
structure break lookback
sets how many bars are used to define the recent structure level.
visuals
glow
turns the glow effect around the wave on or off.
glow intensity
controls the strength of the glow.
bull bear gradient fill
fills the area between the wave and the midline with a bull or bear gradient.
fill transparency
controls how visible the gradient fill is.
higher transparency makes the fill lighter.
lower transparency makes the fill stronger.
tint high low zones
adds a faint background tint to the high and low areas.
color theme
selects the visual color style.
wizard
default bright cyan and red style.
ice
cool blue theme.
inferno
warm orange and red theme.
toxic
green and purple style.
markers
show high low markers
turns all markers on or off.
marker labels
selects the marker text style.
high low
uses early high, early low, confirmed high and confirmed low style labels.
buy sell
uses early buy, early sell, confirmed buy and confirmed sell style labels.
these labels are visual references only, not automatic entries.
show zone labels right
shows high, low and balance labels on the right side of the oscillator.
dashboard
show dashboard
shows or hides the dashboard.
position
selects the dashboard location.
the dashboard displays:
current state
current oscillator value
high score
low score
detection mode
signal types
early high
an early high appears when the wave leaves the high zone and the high score passes the selected requirements.
this means upside pressure may be weakening.
it is not a guaranteed top.
early low
an early low appears when the wave leaves the low zone and the low score passes the selected requirements.
this means downside pressure may be weakening.
it is not a guaranteed bottom.
confirmed high
a confirmed high appears when a pivot high is confirmed and the score is strong enough.
this signal is more selective but appears later.
confirmed low
a confirmed low appears when a pivot low is confirmed and the score is strong enough.
this signal is more selective but appears later.
how to use the alerts
the script includes separate alert conditions:
early high
early low
confirmed high
confirmed low
any early high or low
any confirmed high or low
for fast monitoring, use early alerts.
for cleaner monitoring, use confirmed alerts.
for fewer alerts, use only any confirmed high or low.
recommended anti-spam setup:
use confirmed signals only
increase cooldown between signals
use balanced or confirmed mode
keep pivot right bars at 3 or higher
increase the minimum score if there are too many signals
recommended beginner alert setup:
start with any confirmed high or low
use balanced mode
set cooldown between signals to 8 or more
keep score labels enabled
avoid using every alert condition at the same time
beginner tutorial
step 1: start with balanced mode
balanced mode is the best starting point because it avoids being too fast or too strict.
step 2: keep the default high and low zones
use 80 for the high zone and 20 for the low zone.
this gives a clean first reading.
step 3: watch the wave position
when the wave is above 80, price is stretched toward the high area.
when the wave is below 20, price is stretched toward the low area.
when the wave is around 50, the market is more balanced.
step 4: understand early signals
early signals are warnings.
early high means a possible local top area may be forming.
early low means a possible local bottom area may be forming.
do not enter a trade only because an early signal appears.
step 5: understand confirmed signals
confirmed signals are more selective.
confirmed high means a pivot high has been validated.
confirmed low means a pivot low has been validated.
these signals are slower because the script waits for confirmation.
step 6: read the score
a score near 50 is weaker.
a score near 65 is more acceptable.
a score above 75 is stronger.
a score above 85 means several filters agree.
step 7: confirm on the price chart
before using any signal, check:
trend direction
support and resistance
market structure
candle close
volume reaction
risk to reward
stop loss location
step 8: avoid overloading the chart
do not turn on every filter at once at the beginning.
start with:
balanced mode
wick rejection filter on
divergence in score on
atr exhaustion filter off
structure break filter off
cooldown enabled
after understanding the tool, activate atr exhaustion or structure break if you want stricter signals.
example 1: early high
price pushes upward and the wave moves above the high zone.
then the wave crosses back below the high zone.
an early high appears.
this means the upward push may be losing strength.
a beginner should wait for price rejection or a lower high before considering a short idea.
example 2: confirmed high
price forms a local high.
a few bars later, the pivot is confirmed.
the indicator prints confirmed high at the pivot location.
this is a stronger reference than an early high, but it appears later.
example 3: early low
price drops and the wave moves below the low zone.
then the wave crosses back above the low zone.
an early low appears.
this means downside pressure may be weakening.
a beginner should wait for support reaction or a higher low before considering a long idea.
example 4: confirmed low
price forms a local low.
a few bars later, the pivot is confirmed.
the indicator prints confirmed low at the pivot location.
this is a stronger reference than an early low, but it appears later.
example 5: using cooldown
if the market is volatile, the wave can create several signals close together.
cooldown prevents repeated signals from appearing too often.
higher cooldown values create a cleaner chart.
lower cooldown values create more frequent signals.
best use cases
spotting potential local highs
spotting potential local lows
detecting exhaustion zones
finding momentum fade areas
confirming high and low references with pivots
filtering noisy oscillator signals
building alerts for reversal watchlists
supporting discretionary trading decisions
important notes
early signals are faster but less confirmed.
confirmed signals are more selective but delayed.
pivot-based confirmation cannot appear instantly.
score is a filter, not a prediction.
buy and sell labels are only visual naming options.
the indicator should be combined with price action, structure, volume and risk management.
risk note
this indicator is for technical analysis and educational market study only. it does not provide financial advice, investment advice or guaranteed trading signals. all signals, markers, scores and alerts are references that require independent confirmation and proper risk management.
Script open-source
Dans l'esprit TradingView, le créateur de ce script l'a rendu open source afin que les traders puissent examiner et vérifier ses fonctionnalités. Bravo à l'auteur! Bien que vous puissiez l'utiliser gratuitement, n'oubliez pas que la republication du code est soumise à nos Règles.

Light the candle that sleeps within you.
Clause de non-responsabilité
Les informations et publications ne sont pas destinées à être, et ne constituent pas, des conseils ou recommandations financiers, d'investissement, de trading ou autres fournis ou approuvés par TradingView. Pour en savoir plus, consultez les Conditions d'utilisation.
Script open-source
Dans l'esprit TradingView, le créateur de ce script l'a rendu open source afin que les traders puissent examiner et vérifier ses fonctionnalités. Bravo à l'auteur! Bien que vous puissiez l'utiliser gratuitement, n'oubliez pas que la republication du code est soumise à nos Règles.
Light the candle that sleeps within you.
Clause de non-responsabilité
Les informations et publications ne sont pas destinées à être, et ne constituent pas, des conseils ou recommandations financiers, d'investissement, de trading ou autres fournis ou approuvés par TradingView. Pour en savoir plus, consultez les Conditions d'utilisation.