Mis à jour
Confirmed MTF Support and Resistance Zones
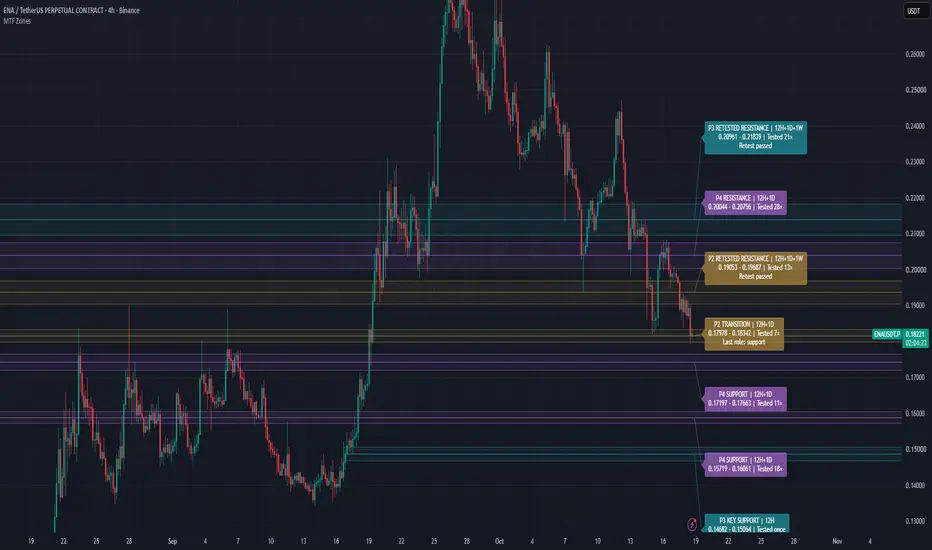
A clearer map of support and resistance
MTF means multi-timeframe: it uses candles from more than one timeframe. This price-only overlay organizes their confirmed turning points into support and resistance zones. It combines main-range boundaries, internal levels, support/resistance role changes and separate freshness tracking in one ranked map.
How zones are built
The script finds confirmed swing highs and lows, sizes zones using typical candle movement (ATR) on their source timeframe, and combines nearby overlapping evidence. Main-range boundaries and internal levels are selected from that evidence. Break and retest tracking distinguishes a possible chart-timeframe break from confirmation on the zone's assigned timeframe.
A swing needs later candles to confirm it. Zones therefore appear with a delay; they are not presented as if they were known at the original high or low.
Importance and freshness are different
Priority controls display order, not bounce probability. Fresh, Tested once and Tested N times separately count returns since a zone became available. More visits do not prove exhausted orders; this script does not measure resting liquidity. For example, P2 KEY SUPPORT | Tested once means higher-priority support with one counted return, not a buy signal.
Read the chart
Solid bands begin when the zone or range became available. Dashed lines point back to earlier originating turns. Diamonds mark availability, not a later priority promotion. Hover labels and diamonds for plain-language explanations, evidence and dates. 12H / 1D / 1W on labels identify the source candle timeframes.
Quick start
Alerts need manual setup
Checking Enable events for a TradingView alert does not start an alert. Configure the choices, open TradingView Create alert, select this indicator and Any alert() function call, choose notifications or a webhook, then click Create.
Detailed messages wait for chart-candle close. By default they watch the previous completed displayed map and allow P1/P2. Approach and separate-visit notices cover regular zones, main-range boundaries and extra swing levels. Break, successful retest and failure messages cover regular tracked zones only. A visit is not necessarily a bounce. Messages are text; the indicator places no orders.
Recreate server alerts after script or setting changes because TradingView saves its own snapshot.
Scope and limits
The rules use price and ATR rather than asset-specific thresholds, across markets with enough history. They do not promise equal predictive performance. There is no volume-profile, nPOC or order-book analysis.
Stored zone edges stay fixed. Priority, role, freshness and visibility can change; older evidence can expire. Chart settings, loaded history and provider revisions can change the reconstructed map.
MTF means multi-timeframe: it uses candles from more than one timeframe. This price-only overlay organizes their confirmed turning points into support and resistance zones. It combines main-range boundaries, internal levels, support/resistance role changes and separate freshness tracking in one ranked map.
How zones are built
The script finds confirmed swing highs and lows, sizes zones using typical candle movement (ATR) on their source timeframe, and combines nearby overlapping evidence. Main-range boundaries and internal levels are selected from that evidence. Break and retest tracking distinguishes a possible chart-timeframe break from confirmation on the zone's assigned timeframe.
A swing needs later candles to confirm it. Zones therefore appear with a delay; they are not presented as if they were known at the original high or low.
Importance and freshness are different
- P1: boundaries of the active main range.
- P2: former range boundaries or qualifying evidence that includes weekly candles or longer.
- P3: other qualifying turns or enough confirmed bounces/rejections.
- P4: remaining confirmed levels.
Priority controls display order, not bounce probability. Fresh, Tested once and Tested N times separately count returns since a zone became available. More visits do not prove exhausted orders; this script does not measure resting liquidity. For example, P2 KEY SUPPORT | Tested once means higher-priority support with one counted return, not a buy signal.
Read the chart
Solid bands begin when the zone or range became available. Dashed lines point back to earlier originating turns. Diamonds mark availability, not a later priority promotion. Hover labels and diamonds for plain-language explanations, evidence and dates. 12H / 1D / 1W on labels identify the source candle timeframes.
Quick start
- Use standard time-based candles. The default sources are 12H, daily and weekly. Sources below your chart timeframe, and duplicates, are ignored.
- Start in Basic mode. It locks technical editing without resetting saved values; Advanced unlocks those controls.
- Choose your visible-zone limit, priority tiers and freshness categories. The default nearby filter considers bands reaching within 5 chart ATR of the last completed close. Main-range boundaries can stay outside for context. Overlap, eligibility and filters can leave fewer zones than the maximum.
- Use the five symbol profiles for exact exchange-qualified symbols. The first enabled match wins; unmatched symbols use global defaults.
Alerts need manual setup
Checking Enable events for a TradingView alert does not start an alert. Configure the choices, open TradingView Create alert, select this indicator and Any alert() function call, choose notifications or a webhook, then click Create.
Detailed messages wait for chart-candle close. By default they watch the previous completed displayed map and allow P1/P2. Approach and separate-visit notices cover regular zones, main-range boundaries and extra swing levels. Break, successful retest and failure messages cover regular tracked zones only. A visit is not necessarily a bounce. Messages are text; the indicator places no orders.
Recreate server alerts after script or setting changes because TradingView saves its own snapshot.
Scope and limits
The rules use price and ATR rather than asset-specific thresholds, across markets with enough history. They do not promise equal predictive performance. There is no volume-profile, nPOC or order-book analysis.
Stored zone edges stay fixed. Priority, role, freshness and visibility can change; older evidence can expire. Chart settings, loaded history and provider revisions can change the reconstructed map.
Notes de version
Renamed the indicator on charts to “Confirmed MTF Support and Resistance Zones” and replaced the example chart with a clean view without manual drawing lines. Calculations, settings and symbol overrides are unchanged.
Clause de non-responsabilité
Les informations et publications ne sont pas destinées à être, et ne constituent pas, des conseils ou recommandations financiers, d'investissement, de trading ou autres fournis ou approuvés par TradingView. Pour en savoir plus, consultez les Conditions d'utilisation.
Clause de non-responsabilité
Les informations et publications ne sont pas destinées à être, et ne constituent pas, des conseils ou recommandations financiers, d'investissement, de trading ou autres fournis ou approuvés par TradingView. Pour en savoir plus, consultez les Conditions d'utilisation.