BTC: US Activity & Coinbase Premium
🇬🇧 ENGLISH
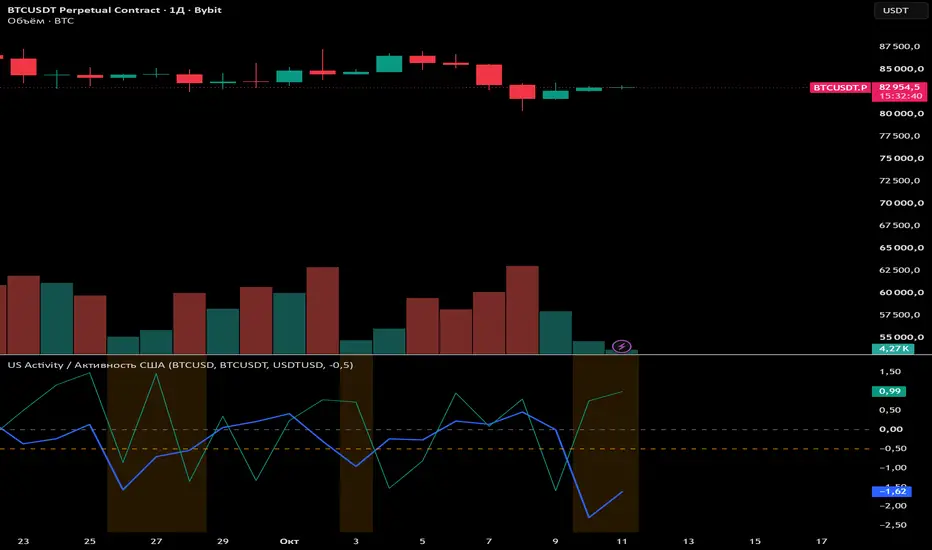
This indicator shows how active US participants in the Bitcoin market are right now and which way they are pushing the price. It compares two venues: Coinbase (BTC-USD), the main US exchange, and Binance (BTCUSDT spot), the largest global one.
1. US Activity (blue line)
The ratio of Coinbase BTC-USD volume to Binance BTCUSDT volume over the last 24 hours (rolling window), in log scale, expressed as a z-score against its 30-day mean.
• Above 0 — US traders are more active than usual.
• Below the threshold (default −0.5) — US activity is low; the background is highlighted orange.
2. Coinbase Premium (teal line)
Price of Coinbase BTC-USD relative to Binance BTCUSDT, adjusted for the USDT-USD rate (from Coinbase), expressed as a z-score against its 4-day mean.
• Above 0 — Bitcoin trades richer on Coinbase than usual: US buying pressure.
• Below 0 — cheaper on Coinbase: US selling pressure.
How to use
The indicator does not generate entry signals on its own. It is a context filter for other strategies:
• Orange background (low US activity) — a thin market. In my historical research, short-term signals from other systems performed worse during these periods; consider skipping them or reducing size.
• Coinbase premium on the side of your trade (long with premium above 0, short with premium below 0) means US demand is with you. Treat it as a hint, not a rule: historically the effect is visible mainly in 2023–2026 and was absent in 2021–2022.
Inputs: Coinbase BTC-USD, Binance BTCUSDT and Coinbase USDT-USD symbols; low US activity threshold in z units (default −0.5).
Timeframes: 15 minutes to 4 hours recommended. Windows (1 day, 4 days, 30 days) are converted into bars of the current timeframe. The US Activity line is empty for the first 30 days of history while the window fills.
Alerts: "US activity became low" and "US activity is back" (threshold crossings).
Disclaimer: for informational purposes only, not financial advice. Past performance does not guarantee future results.
———————————————
🇷🇺 РУССКИЙ
Индикатор показывает, насколько активны американские участники рынка биткоина прямо сейчас и в какую сторону они давят на цену. Сравниваются две площадки: Coinbase (BTC-USD) — основная биржа США, и Binance (BTCUSDT, спот) — крупнейшая мировая.
1. Активность США (синяя линия)
Отношение объёма торгов Coinbase BTC-USD к объёму Binance BTCUSDT за последние сутки (скользящее окно), в логарифме, в виде z-оценки — на сколько стандартных отклонений текущее значение отличается от среднего за 30 дней.
• Выше 0 — американцы торгуют активнее обычного.
• Ниже порога (по умолчанию −0.5) — активность США низкая, фон подсвечивается оранжевым.
2. Премия Coinbase (бирюзовая линия)
Цена Coinbase BTC-USD к цене Binance BTCUSDT с поправкой на курс USDT-USD (с Coinbase), в виде z-оценки относительно среднего за 4 дня.
• Выше 0 — на Coinbase дороже обычного: покупательский спрос из США.
• Ниже 0 — на Coinbase дешевле: преобладают продажи из США.
Как использовать
Индикатор не даёт сигналов входа сам по себе. Это фильтр контекста для других стратегий:
• Оранжевый фон (активность США низкая) — рынок тонкий. В моём исследовании на истории краткосрочные сигналы других систем в такие периоды отрабатывали хуже; их разумно пропускать или уменьшать объём.
• Премия Coinbase в сторону вашей сделки (покупка при премии выше 0, продажа при премии ниже 0) — спрос США на вашей стороне. Это подсказка, а не правило: на истории эффект заметен в основном в 2023–2026 годах, в 2021–2022 его не было.
Настройки: символы Coinbase BTC-USD, Binance BTCUSDT и Coinbase USDT-USD; порог «активность США низкая» в единицах z (по умолчанию −0.5).
Таймфреймы: рекомендуются от 15 минут до 4 часов. Окна (сутки, 4 дня, 30 дней) пересчитываются в бары текущего таймфрейма. Первые 30 дней истории линия активности пустая — идёт накопление окна.
Оповещения: «Активность США стала низкой» и «Активность США вернулась» (пересечение порога).
Отказ от ответственности: индикатор носит информационный характер и не является инвестиционной рекомендацией. Прошлые результаты не гарантируют будущих.
This indicator shows how active US participants in the Bitcoin market are right now and which way they are pushing the price. It compares two venues: Coinbase (BTC-USD), the main US exchange, and Binance (BTCUSDT spot), the largest global one.
1. US Activity (blue line)
The ratio of Coinbase BTC-USD volume to Binance BTCUSDT volume over the last 24 hours (rolling window), in log scale, expressed as a z-score against its 30-day mean.
• Above 0 — US traders are more active than usual.
• Below the threshold (default −0.5) — US activity is low; the background is highlighted orange.
2. Coinbase Premium (teal line)
Price of Coinbase BTC-USD relative to Binance BTCUSDT, adjusted for the USDT-USD rate (from Coinbase), expressed as a z-score against its 4-day mean.
• Above 0 — Bitcoin trades richer on Coinbase than usual: US buying pressure.
• Below 0 — cheaper on Coinbase: US selling pressure.
How to use
The indicator does not generate entry signals on its own. It is a context filter for other strategies:
• Orange background (low US activity) — a thin market. In my historical research, short-term signals from other systems performed worse during these periods; consider skipping them or reducing size.
• Coinbase premium on the side of your trade (long with premium above 0, short with premium below 0) means US demand is with you. Treat it as a hint, not a rule: historically the effect is visible mainly in 2023–2026 and was absent in 2021–2022.
Inputs: Coinbase BTC-USD, Binance BTCUSDT and Coinbase USDT-USD symbols; low US activity threshold in z units (default −0.5).
Timeframes: 15 minutes to 4 hours recommended. Windows (1 day, 4 days, 30 days) are converted into bars of the current timeframe. The US Activity line is empty for the first 30 days of history while the window fills.
Alerts: "US activity became low" and "US activity is back" (threshold crossings).
Disclaimer: for informational purposes only, not financial advice. Past performance does not guarantee future results.
———————————————
🇷🇺 РУССКИЙ
Индикатор показывает, насколько активны американские участники рынка биткоина прямо сейчас и в какую сторону они давят на цену. Сравниваются две площадки: Coinbase (BTC-USD) — основная биржа США, и Binance (BTCUSDT, спот) — крупнейшая мировая.
1. Активность США (синяя линия)
Отношение объёма торгов Coinbase BTC-USD к объёму Binance BTCUSDT за последние сутки (скользящее окно), в логарифме, в виде z-оценки — на сколько стандартных отклонений текущее значение отличается от среднего за 30 дней.
• Выше 0 — американцы торгуют активнее обычного.
• Ниже порога (по умолчанию −0.5) — активность США низкая, фон подсвечивается оранжевым.
2. Премия Coinbase (бирюзовая линия)
Цена Coinbase BTC-USD к цене Binance BTCUSDT с поправкой на курс USDT-USD (с Coinbase), в виде z-оценки относительно среднего за 4 дня.
• Выше 0 — на Coinbase дороже обычного: покупательский спрос из США.
• Ниже 0 — на Coinbase дешевле: преобладают продажи из США.
Как использовать
Индикатор не даёт сигналов входа сам по себе. Это фильтр контекста для других стратегий:
• Оранжевый фон (активность США низкая) — рынок тонкий. В моём исследовании на истории краткосрочные сигналы других систем в такие периоды отрабатывали хуже; их разумно пропускать или уменьшать объём.
• Премия Coinbase в сторону вашей сделки (покупка при премии выше 0, продажа при премии ниже 0) — спрос США на вашей стороне. Это подсказка, а не правило: на истории эффект заметен в основном в 2023–2026 годах, в 2021–2022 его не было.
Настройки: символы Coinbase BTC-USD, Binance BTCUSDT и Coinbase USDT-USD; порог «активность США низкая» в единицах z (по умолчанию −0.5).
Таймфреймы: рекомендуются от 15 минут до 4 часов. Окна (сутки, 4 дня, 30 дней) пересчитываются в бары текущего таймфрейма. Первые 30 дней истории линия активности пустая — идёт накопление окна.
Оповещения: «Активность США стала низкой» и «Активность США вернулась» (пересечение порога).
Отказ от ответственности: индикатор носит информационный характер и не является инвестиционной рекомендацией. Прошлые результаты не гарантируют будущих.

Clause de non-responsabilité
Les informations et publications ne sont pas destinées à être, et ne constituent pas, des conseils ou recommandations financiers, d'investissement, de trading ou autres fournis ou approuvés par TradingView. Pour en savoir plus, consultez les Conditions d'utilisation.
Clause de non-responsabilité
Les informations et publications ne sont pas destinées à être, et ne constituent pas, des conseils ou recommandations financiers, d'investissement, de trading ou autres fournis ou approuvés par TradingView. Pour en savoir plus, consultez les Conditions d'utilisation.