Dynamic Breakout Recovery Channel [Pineify]
Overview
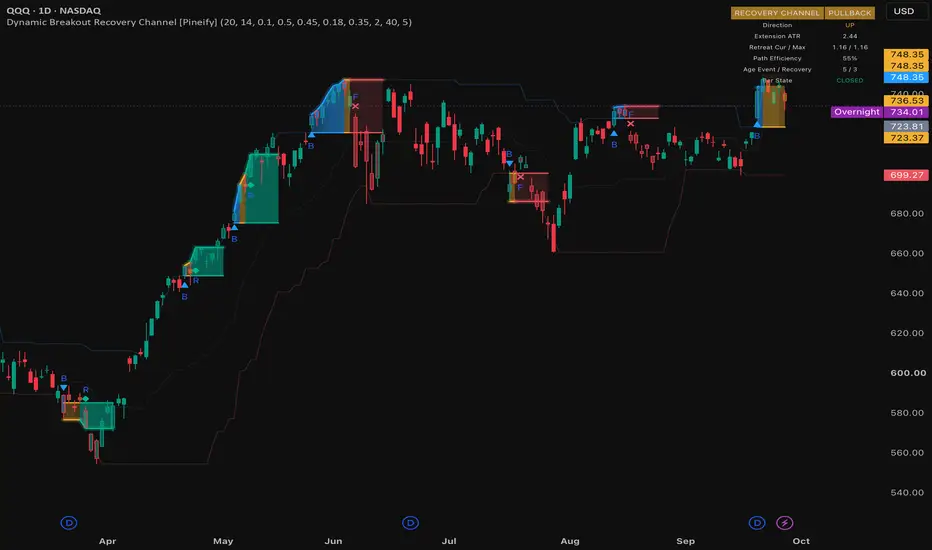
This Donchian breakout indicator turns each confirmed break into a bounded lifecycle. A state-colored price corridor shows extension, pullback, recovery, failure, or expiry against a frozen event level and ATR.
Problem Definition
A normal Donchian signal says only that price closed beyond a prior range. It cannot separate useful extension from a marginal break, an orderly retest from churn, or recovery from failure. Because a live channel keeps moving, it also changes the reference used to judge later bars. Similar crossings can therefore hide different paths. This script freezes one baseline and evaluates the sequence after the break.
Design Rationale
The boundary excludes the current bar, so the breakout cannot raise the level it must cross. ATR is frozen at confirmation; otherwise later volatility would rescale earlier movement. The best confirmed high or low becomes the frontier. Pullback evaluation starts only after minimum extension and retreat, preventing an immediate re-entry from qualifying as recovery. A timer alone was rejected because equal ages can contain direct progress or repeated travel. Time is instead combined with frontier retention, path efficiency, and maximum-retreat resilience.
Key Features
How It Works
The boundaries are the preceding window's highest high and lowest low. After warm-up, a confirmed close must cross by the selected ATR fraction. One lifecycle is active.
Confirmation freezes direction, boundary, ATR, close, and frontier. Later confirmed bars update the frontier and cumulative close travel. Extension is boundary to frontier, retreat is frontier to close, and net distance is boundary to close. All use frozen ATR units. EXPANSION becomes PULLBACK after extension and arm thresholds. An adverse boundary penetration confirms FAILED; a PULLBACK close outside the boundary and near the frontier confirms RECOVERED; maximum age produces EXPIRED.
Expansion opacity follows extension. Pullback opacity blends retained progress, path efficiency, recovery time, and retreat resilience. Terminal states then reset.
How Multiple Indicators Work Together
The components form one chain. Donchian extremes define the event; frozen ATR supplies one distance unit; the frontier defines achieved progress; retreat and path length describe how progress was surrendered; the clock measures delay. Removing any stage changes the question. The state machine combines them only after prerequisites exist, and the corridor returns the result to price space.
Trading Ideas and Insights
Use the overlay to compare paths, not as an order instruction. Blue shows confirmed expansion, amber an eligible pullback, teal recovery near the frontier, red failure through the boundary, and purple timeout. Corridor width shows achieved excursion; opacity summarizes path quality. These states can organize continuation, trend-recovery, and failed-breakout review, but do not estimate future return or success probability.
Unique Aspects
The contribution is event-relative memory. Common breakout channels keep rolling and reduce outcome to above or below a changing band. Here boundary and ATR stay fixed while frontier, deepest confirmed retreat, cumulative path, and recovery duration are retained. Recovery requires an extension-pullback-return sequence. Width, hue, and opacity map to excursion, phase, and quality rather than decoration.
How to Use
Customization
Shorter channels create more local events; longer channels select broader breaks. Breakout distance controls initial separation. Extension and pullback-arm settings decide when recovery evaluation begins. Recovery tolerance controls return toward the frontier; failure depth controls boundary penetration. Extension target changes opacity only. Maximum life changes observation scope, while terminal hold changes display duration.
Assumptions and Limitations
The model assumes OHLC and ATR suit the market and timeframe. It sees bar aggregates, not order flow, liquidity, slippage, or execution. Gaps may cross several thresholds. One event is tracked, so opposite breaks wait for reset. States and alerts confirm at bar close; open-bar dashboard distances and opacity can still vary with the live close.
Donchian and ATR windows add lag and parameter sensitivity. Failure depth may reject normal retests or retain broken structures. Maximum age can expire slow recovery, and low ATR can magnify small moves. States express configured rules, not market truth. No stops, sizing, targets, backtest, profitability evidence, or prediction are supplied.
Conclusion
A frozen reference makes the post-breakout path auditable. The corridor shows phase, excursion, and recovery quality without claiming predictive performance.
This Donchian breakout indicator turns each confirmed break into a bounded lifecycle. A state-colored price corridor shows extension, pullback, recovery, failure, or expiry against a frozen event level and ATR.
Problem Definition
A normal Donchian signal says only that price closed beyond a prior range. It cannot separate useful extension from a marginal break, an orderly retest from churn, or recovery from failure. Because a live channel keeps moving, it also changes the reference used to judge later bars. Similar crossings can therefore hide different paths. This script freezes one baseline and evaluates the sequence after the break.
Design Rationale
The boundary excludes the current bar, so the breakout cannot raise the level it must cross. ATR is frozen at confirmation; otherwise later volatility would rescale earlier movement. The best confirmed high or low becomes the frontier. Pullback evaluation starts only after minimum extension and retreat, preventing an immediate re-entry from qualifying as recovery. A timer alone was rejected because equal ages can contain direct progress or repeated travel. Time is instead combined with frontier retention, path efficiency, and maximum-retreat resilience.
Key Features
- Prior-window Donchian breaks filtered by ATR distance.
- Frozen boundary and ATR with frontier, retreat, path, and time memory.
- Confirmed EXPANSION, PULLBACK, RECOVERED, FAILED, and EXPIRED states.
- Optional channel, bar color, markers, and dashboard.
How It Works
The boundaries are the preceding window's highest high and lowest low. After warm-up, a confirmed close must cross by the selected ATR fraction. One lifecycle is active.
Confirmation freezes direction, boundary, ATR, close, and frontier. Later confirmed bars update the frontier and cumulative close travel. Extension is boundary to frontier, retreat is frontier to close, and net distance is boundary to close. All use frozen ATR units. EXPANSION becomes PULLBACK after extension and arm thresholds. An adverse boundary penetration confirms FAILED; a PULLBACK close outside the boundary and near the frontier confirms RECOVERED; maximum age produces EXPIRED.
Expansion opacity follows extension. Pullback opacity blends retained progress, path efficiency, recovery time, and retreat resilience. Terminal states then reset.
How Multiple Indicators Work Together
The components form one chain. Donchian extremes define the event; frozen ATR supplies one distance unit; the frontier defines achieved progress; retreat and path length describe how progress was surrendered; the clock measures delay. Removing any stage changes the question. The state machine combines them only after prerequisites exist, and the corridor returns the result to price space.
Trading Ideas and Insights
Use the overlay to compare paths, not as an order instruction. Blue shows confirmed expansion, amber an eligible pullback, teal recovery near the frontier, red failure through the boundary, and purple timeout. Corridor width shows achieved excursion; opacity summarizes path quality. These states can organize continuation, trend-recovery, and failed-breakout review, but do not estimate future return or success probability.
Unique Aspects
The contribution is event-relative memory. Common breakout channels keep rolling and reduce outcome to above or below a changing band. Here boundary and ATR stay fixed while frontier, deepest confirmed retreat, cumulative path, and recovery duration are retained. Recovery requires an extension-pullback-return sequence. Width, hue, and opacity map to excursion, phase, and quality rather than decoration.
How to Use
- Choose a Donchian lookback matching the structure under review.
- Set minimum breakout distance to reject marginal closes.
- Tune extension, pullback, recovery, and failure distances together in ATR units across several regimes.
- Read the frozen-boundary corridor first; use markers and the dashboard for transition detail.
- Configure confirmed breakout, recovery, or failure alerts at the intended frequency.
Customization
Shorter channels create more local events; longer channels select broader breaks. Breakout distance controls initial separation. Extension and pullback-arm settings decide when recovery evaluation begins. Recovery tolerance controls return toward the frontier; failure depth controls boundary penetration. Extension target changes opacity only. Maximum life changes observation scope, while terminal hold changes display duration.
Assumptions and Limitations
The model assumes OHLC and ATR suit the market and timeframe. It sees bar aggregates, not order flow, liquidity, slippage, or execution. Gaps may cross several thresholds. One event is tracked, so opposite breaks wait for reset. States and alerts confirm at bar close; open-bar dashboard distances and opacity can still vary with the live close.
Donchian and ATR windows add lag and parameter sensitivity. Failure depth may reject normal retests or retain broken structures. Maximum age can expire slow recovery, and low ATR can magnify small moves. States express configured rules, not market truth. No stops, sizing, targets, backtest, profitability evidence, or prediction are supplied.
Conclusion
A frozen reference makes the post-breakout path auditable. The corridor shows phase, excursion, and recovery quality without claiming predictive performance.

🚀🚀🚀 Pineify - pineify.app
Essential Toolkit for Every Trader
- AI Pine Script Generator
- Finance AI Agent
- AI Stock Picker
- Pine Script Visual Editor
- Invited indicators
- Strategy Optimizer
- Trading Journal
- Backtest Report
Essential Toolkit for Every Trader
- AI Pine Script Generator
- Finance AI Agent
- AI Stock Picker
- Pine Script Visual Editor
- Invited indicators
- Strategy Optimizer
- Trading Journal
- Backtest Report
Clause de non-responsabilité
Les informations et publications ne sont pas destinées à être, et ne constituent pas, des conseils ou recommandations financiers, d'investissement, de trading ou autres fournis ou approuvés par TradingView. Pour en savoir plus, consultez les Conditions d'utilisation.
🚀🚀🚀 Pineify - pineify.app
Essential Toolkit for Every Trader
- AI Pine Script Generator
- Finance AI Agent
- AI Stock Picker
- Pine Script Visual Editor
- Invited indicators
- Strategy Optimizer
- Trading Journal
- Backtest Report
Essential Toolkit for Every Trader
- AI Pine Script Generator
- Finance AI Agent
- AI Stock Picker
- Pine Script Visual Editor
- Invited indicators
- Strategy Optimizer
- Trading Journal
- Backtest Report
Clause de non-responsabilité
Les informations et publications ne sont pas destinées à être, et ne constituent pas, des conseils ou recommandations financiers, d'investissement, de trading ou autres fournis ou approuvés par TradingView. Pour en savoir plus, consultez les Conditions d'utilisation.