J - 200sma Band Tracker
(2022)
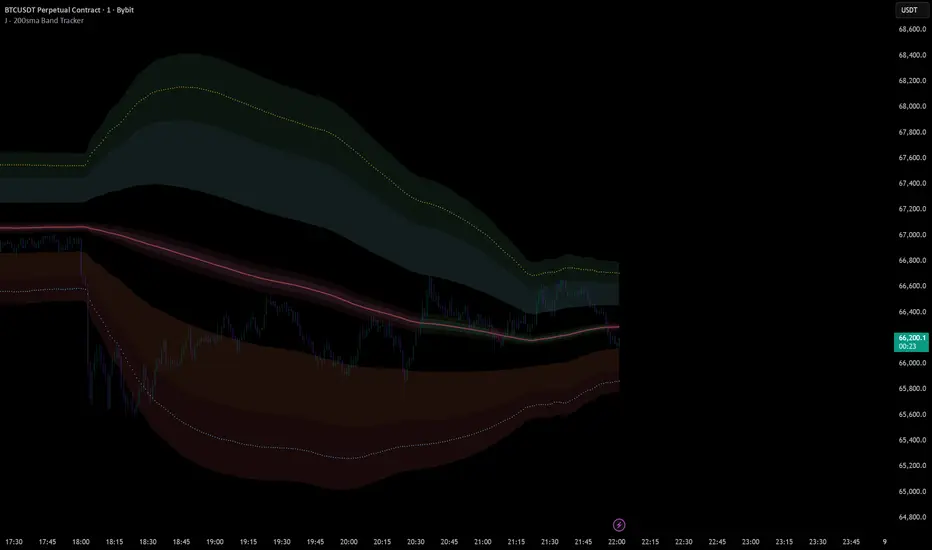
A Bollinger Band-based overlay that tracks price equilibrium using a 200 SMA as its core.
It layers multiple standard deviation bands (1–3σ) to highlight overbought/oversold zones, a narrow band to show tight consolidation, and an inner band to visualize micro price positioning.
A Bollinger Band-based overlay that tracks price equilibrium using a 200 SMA as its core.
It layers multiple standard deviation bands (1–3σ) to highlight overbought/oversold zones, a narrow band to show tight consolidation, and an inner band to visualize micro price positioning.

No courses, don't sell signals — just my own edge, stats public: jalgo.ca/
Clause de non-responsabilité
Les informations et publications ne sont pas destinées à être, et ne constituent pas, des conseils ou recommandations financiers, d'investissement, de trading ou autres fournis ou approuvés par TradingView. Pour en savoir plus, consultez les Conditions d'utilisation.
Clause de non-responsabilité
Les informations et publications ne sont pas destinées à être, et ne constituent pas, des conseils ou recommandations financiers, d'investissement, de trading ou autres fournis ou approuvés par TradingView. Pour en savoir plus, consultez les Conditions d'utilisation.