OPEN-SOURCE SCRIPT
Mis à jour [ A L P H A X ] Session Levels Map
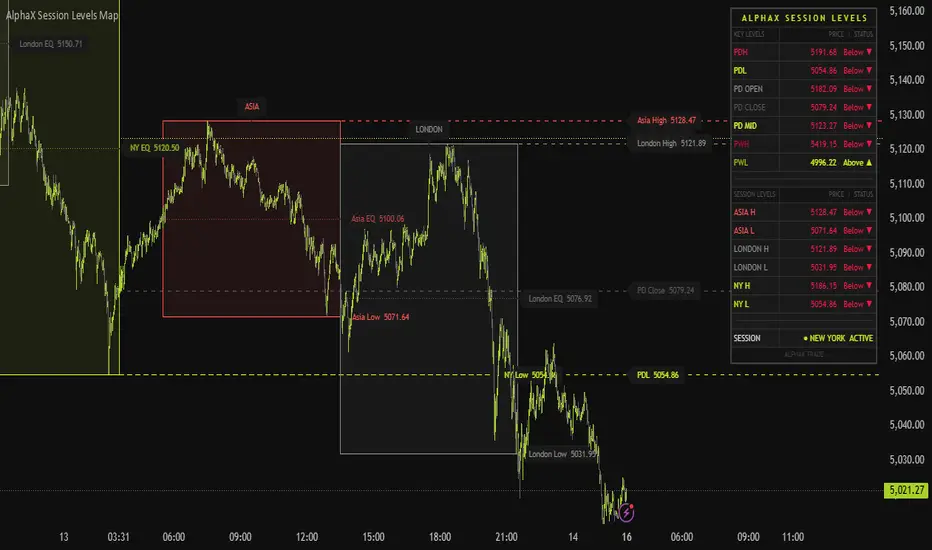
AlphaX Session Levels Map — Session Boxes, H/L Extensions, PDH/PDL, PWH/PWL, EQ Midpoints & Live Level Status Table
AlphaX Session Levels Map is a comprehensive session structure and key level visualization tool built for traders who use institutional time-based analysis. It maps the three major trading sessions — Asia, London, and New York — alongside Previous Day and Previous Week high, low, open, and close levels, all on a single clean overlay with a live reference table showing every level's current price and status in real time.
━━━━━━━━━━━━━━━━━━━━━━━━━━━━━━━━━━━━━━━━
🕐 Session Mapping
Each session — Asia, London, and New York — is tracked independently from its configurable GMT start time to its end time. As price moves through the session, the indicator builds the session range in real time, recording the highest high and lowest low reached.
When the session closes, the indicator draws:
All session drawings are controlled by a Sessions to Show setting — older sessions beyond your chosen limit are automatically removed, keeping the chart clean regardless of how far back you scroll.
━━━━━━━━━━━━━━━━━━━━━━━━━━━━━━━━━━━━━━━━
📐 Key Levels
Previous Day High / Low (PDH / PDL)
Plotted at the start of each new trading day using the prior day's confirmed high and low. Lines extend forward across the current day and labels follow price to the right edge of the chart at all times.
Previous Day Open / Close
The prior day's open and close prices plotted as separate lines — useful for identifying whether the current day is trading above or below the previous day's range midpoint and for gauging bullish or bearish displacement.
Previous Day Midpoint (PD Mid)
The exact 50% equilibrium of the previous day's high-to-low range. A key reference level for mean reversion setups and judging whether price is premium or discount relative to the prior day.
Previous Week High / Low (PWH / PWL)
Plotted at the start of each new week using the prior week's confirmed high and low. Drawn one width heavier than daily levels to visually distinguish their higher timeframe significance.
━━━━━━━━━━━━━━━━━━━━━━━━━━━━━━━━━━━━━━━━
📋 Live Level Status Table
A compact reference table updates on every bar and shows every active level at a glance:
The table covers all active levels: PDH, PDL, PD Open, PD Close, PD Mid, PWH, PWL, Asia H/L, London H/L, and NY H/L. Levels that are disabled in settings are automatically hidden from the table — no blank rows or clutter.
━━━━━━━━━━━━━━━━━━━━━━━━━━━━━━━━━━━━━━━━
⚡ Key Features
━━━━━━━━━━━━━━━━━━━━━━━━━━━━━━━━━━━━━━━━
🔔 Alert Conditions
All alert messages are prefixed with [AlphaX] for clean identification in webhook and notification workflows.
━━━━━━━━━━━━━━━━━━━━━━━━━━━━━━━━━━━━━━━━
⚙ Settings Reference
Session Settings
Session Times (GMT)
Key Levels
Level Style
Session Background
Info Table
━━━━━━━━━━━━━━━━━━━━━━━━━━━━━━━━━━━━━━━━
🚀 How to Use
━━━━━━━━━━━━━━━━━━━━━━━━━━━━━━━━━━━━━━━━
👥 Who This Is For
━━━━━━━━━━━━━━━━━━━━━━━━━━━━━━━━━━━━━━━━
📝 Notes
━━━━━━━━━━━━━━━━━━━━━━━━━━━━━━━━━━━━━━━━
⚠ Disclaimer
This indicator is a technical analysis and visualization tool intended for educational and informational purposes only. It does not constitute financial advice or a recommendation to buy or sell any financial instrument. All key levels shown are derived from historical price data and their significance as support, resistance, or reaction zones is not guaranteed. Past reactions at these levels do not guarantee future reactions. Always conduct your own analysis and consult a licensed financial advisor before making any trading decisions. The author accepts no responsibility for any losses incurred from the use of this indicator.
━━━━━━━━━━━━━━━━━━━━━━━━━━━━━━━━━━━━━━━━
Built for traders who read the market the way institutions move it.
AlphaX Session Levels Map is a comprehensive session structure and key level visualization tool built for traders who use institutional time-based analysis. It maps the three major trading sessions — Asia, London, and New York — alongside Previous Day and Previous Week high, low, open, and close levels, all on a single clean overlay with a live reference table showing every level's current price and status in real time.
━━━━━━━━━━━━━━━━━━━━━━━━━━━━━━━━━━━━━━━━
🕐 Session Mapping
Each session — Asia, London, and New York — is tracked independently from its configurable GMT start time to its end time. As price moves through the session, the indicator builds the session range in real time, recording the highest high and lowest low reached.
When the session closes, the indicator draws:
- A session box spanning the full session range from open bar to close bar, clearly marking the price area the session occupied
- A session name label centered inside the box at the session high
- An EQ midpoint line at the exact equilibrium between the session high and low — the 50% level of the range, a key reference for ICT and SMC traders
- Extended H/L lines that project forward from the session close and remain active until price breaks through them — at which point the line terminates exactly at the breakout bar
All session drawings are controlled by a Sessions to Show setting — older sessions beyond your chosen limit are automatically removed, keeping the chart clean regardless of how far back you scroll.
━━━━━━━━━━━━━━━━━━━━━━━━━━━━━━━━━━━━━━━━
📐 Key Levels
Previous Day High / Low (PDH / PDL)
Plotted at the start of each new trading day using the prior day's confirmed high and low. Lines extend forward across the current day and labels follow price to the right edge of the chart at all times.
Previous Day Open / Close
The prior day's open and close prices plotted as separate lines — useful for identifying whether the current day is trading above or below the previous day's range midpoint and for gauging bullish or bearish displacement.
Previous Day Midpoint (PD Mid)
The exact 50% equilibrium of the previous day's high-to-low range. A key reference level for mean reversion setups and judging whether price is premium or discount relative to the prior day.
Previous Week High / Low (PWH / PWL)
Plotted at the start of each new week using the prior week's confirmed high and low. Drawn one width heavier than daily levels to visually distinguish their higher timeframe significance.
━━━━━━━━━━━━━━━━━━━━━━━━━━━━━━━━━━━━━━━━
📋 Live Level Status Table
A compact reference table updates on every bar and shows every active level at a glance:
- Level — the name of the level, color-coded to match its line on the chart
- Price — the exact price of the level formatted to the instrument's tick size
- Status — whether price is currently Above ▲ or Below ▼ the level, color-coded green and red in real time
The table covers all active levels: PDH, PDL, PD Open, PD Close, PD Mid, PWH, PWL, Asia H/L, London H/L, and NY H/L. Levels that are disabled in settings are automatically hidden from the table — no blank rows or clutter.
━━━━━━━━━━━━━━━━━━━━━━━━━━━━━━━━━━━━━━━━
⚡ Key Features
- 🕐 Three fully configurable sessions — Asia, London, New York — with independent GMT start and end time inputs
- 📦 Session range boxes with customizable border and fill colors per session
- ➡ Extended session H/L lines that automatically terminate when price breaks the level
- ⚖ EQ midpoint lines for every completed session — the 50% equilibrium of the session range
- 📅 Previous Day High, Low, Open, Close, and Midpoint — updated automatically at each day open
- 📆 Previous Week High and Low — updated automatically at each week open
- 📋 Live level status table — price and Above/Below status for every active level
- 🎨 Fully customizable colors for every session and every level type independently
- 🔔 10 alert conditions — session starts, session ends, PDH/PDL breaks, PWH/PWL breaks
- 🌐 Optional session background highlighting per session
- 📐 Configurable line style (Solid / Dashed / Dotted), line width, and label size
- 🔢 Sessions to Show control — automatically trims older session drawings beyond your limit
━━━━━━━━━━━━━━━━━━━━━━━━━━━━━━━━━━━━━━━━
🔔 Alert Conditions
- Asia Session Start / End
- London Session Start / End
- New York Session Start / End
- Price broke above / below Previous Day High or Low
- Price broke above / below Previous Week High or Low
All alert messages are prefixed with [AlphaX] for clean identification in webhook and notification workflows.
━━━━━━━━━━━━━━━━━━━━━━━━━━━━━━━━━━━━━━━━
⚙ Settings Reference
Session Settings
- Show Asia / London / New York Session — toggle each session independently
- Show Session Boxes — filled range boxes for completed sessions
- Show Session Labels — session name label centered at the session high
- Extend Session H/L Until Broken — projects H/L lines forward until price breaks them
- Sessions to Show — number of past sessions to keep visible on the chart
Session Times (GMT)
- Configurable start and end hour and minute for each session in GMT/UTC
- Default times: Asia 00:00–08:00, London 08:00–16:00, New York 13:00–21:00
- Overlap periods (London/NY) are handled naturally — each session tracks independently
Key Levels
- Show Previous Day High/Low — PDH and PDL lines with labels
- Show Previous Day Open/Close — PD Open and PD Close lines
- Show Previous Week High/Low — PWH and PWL lines, drawn one width heavier
- Show Session Midpoints (EQ) — 50% equilibrium line for each completed session
- Show Previous Day Midpoint — 50% of prior day's high-to-low range
- Individual color pickers for every level type
Level Style
- Level Line Width — thickness of all key level lines
- Session H/L Line Width — thickness of extended session H/L lines
- Level Line Style — Solid, Dashed, or Dotted
- Label Size — Tiny, Small, or Normal
Session Background
- Optional background highlight color during each active session
- Independent color and transparency control per session
Info Table
- Show / hide the level reference table
- Table position — Top Left, Top Right, Bottom Left, Bottom Right
- Table text color — customizable value color
━━━━━━━━━━━━━━━━━━━━━━━━━━━━━━━━━━━━━━━━
🚀 How to Use
- Add AlphaX Session Levels Map to your chart on any intraday timeframe — M1 through H1 works best
- Check the live table immediately — it shows you at a glance whether price is above or below every key level without needing to scan the chart
- Use PDH and PDL as the first reference for the day — a clean break and hold above PDH is bullish displacement; a rejection at PDH is a premium reversal zone
- Use PWH and PWL for higher timeframe context — these are the weekly liquidity pools that institutional flow targets
- Watch Asia High and Low during London open — London frequently raids one side of the Asia range before committing to direction
- Use session EQ midpoints for mean reversion entries — price returning to a session's 50% level after displacement is a high-probability setup in ICT methodology
- Enable session background highlighting during live trading to instantly identify which session is currently active
- Set PDH/PDL and PWH/PWL break alerts with your webhook URL for real-time notifications when key levels are breached
━━━━━━━━━━━━━━━━━━━━━━━━━━━━━━━━━━━━━━━━
👥 Who This Is For
- 🥇 Gold (XAUUSD) traders — session levels are among the most reliable reference points for XAUUSD intraday structure
- 📉 Forex traders — Asia, London, and NY session highs and lows are foundational to smart money and ICT-based analysis on all major pairs
- 📊 Index traders — session structure is equally applicable to US30, NAS100, SPX500, and DAX
- 🧠 ICT and SMC traders — PDH, PDL, PWH, PWL, and EQ midpoints are core concepts in ICT methodology; this tool maps all of them automatically
- 📈 Multi-session traders — the live status table makes it easy to track where price sits relative to all timeframes simultaneously
━━━━━━━━━━━━━━━━━━━━━━━━━━━━━━━━━━━━━━━━
📝 Notes
- All session times are based on GMT/UTC — adjust start and end hours to match your broker's GMT offset if needed
- Designed for intraday timeframes — M1 to H1. On daily or weekly charts session boxes will not render meaningfully
- Previous Day and Week levels use confirmed closed bars via request.security — no repainting
- Extended H/L lines terminate at the exact bar where price breaks them — the break is detected on bar close for high timeframes and intrabar for lower timeframes depending on chart resolution
- Sessions to Show controls drawings for boxes, labels, and midpoints — extended H/L lines always show only the most recent session's projection
━━━━━━━━━━━━━━━━━━━━━━━━━━━━━━━━━━━━━━━━
⚠ Disclaimer
This indicator is a technical analysis and visualization tool intended for educational and informational purposes only. It does not constitute financial advice or a recommendation to buy or sell any financial instrument. All key levels shown are derived from historical price data and their significance as support, resistance, or reaction zones is not guaranteed. Past reactions at these levels do not guarantee future reactions. Always conduct your own analysis and consult a licensed financial advisor before making any trading decisions. The author accepts no responsibility for any losses incurred from the use of this indicator.
━━━━━━━━━━━━━━━━━━━━━━━━━━━━━━━━━━━━━━━━
Built for traders who read the market the way institutions move it.
Notes de version
Update:• Dashboard UI restyled for a cleaner look
• Added dashboard resizing option so users can adjust the panel size based on their screen
Notes de version
Minor style changes.Script open-source
Dans l'esprit TradingView, le créateur de ce script l'a rendu open source afin que les traders puissent examiner et vérifier ses fonctionnalités. Bravo à l'auteur! Bien que vous puissiez l'utiliser gratuitement, n'oubliez pas que la republication du code est soumise à nos Règles.

🌐 alphax.trading
Institutional Grade Signals --> Engineered for Retail
💎ᴠɪᴘ tradingview.com/v/TaXohZvb/
[ A L P H A X ] PRIME - Premium Signal Engine
🔢 alphax.trading/resources/calculators
AlphaX Calculators
Institutional Grade Signals --> Engineered for Retail
💎ᴠɪᴘ tradingview.com/v/TaXohZvb/
[ A L P H A X ] PRIME - Premium Signal Engine
🔢 alphax.trading/resources/calculators
AlphaX Calculators
Clause de non-responsabilité
Les informations et publications ne sont pas destinées à être, et ne constituent pas, des conseils ou recommandations financiers, d'investissement, de trading ou autres fournis ou approuvés par TradingView. Pour en savoir plus, consultez les Conditions d'utilisation.
Script open-source
Dans l'esprit TradingView, le créateur de ce script l'a rendu open source afin que les traders puissent examiner et vérifier ses fonctionnalités. Bravo à l'auteur! Bien que vous puissiez l'utiliser gratuitement, n'oubliez pas que la republication du code est soumise à nos Règles.
🌐 alphax.trading
Institutional Grade Signals --> Engineered for Retail
💎ᴠɪᴘ tradingview.com/v/TaXohZvb/
[ A L P H A X ] PRIME - Premium Signal Engine
🔢 alphax.trading/resources/calculators
AlphaX Calculators
Institutional Grade Signals --> Engineered for Retail
💎ᴠɪᴘ tradingview.com/v/TaXohZvb/
[ A L P H A X ] PRIME - Premium Signal Engine
🔢 alphax.trading/resources/calculators
AlphaX Calculators
Clause de non-responsabilité
Les informations et publications ne sont pas destinées à être, et ne constituent pas, des conseils ou recommandations financiers, d'investissement, de trading ou autres fournis ou approuvés par TradingView. Pour en savoir plus, consultez les Conditions d'utilisation.