OPEN-SOURCE SCRIPT
Mis à jour Cross-Ticker AMT + POC Ladder
Cross-Ticker AMT + POC Ladder
OVERVIEW
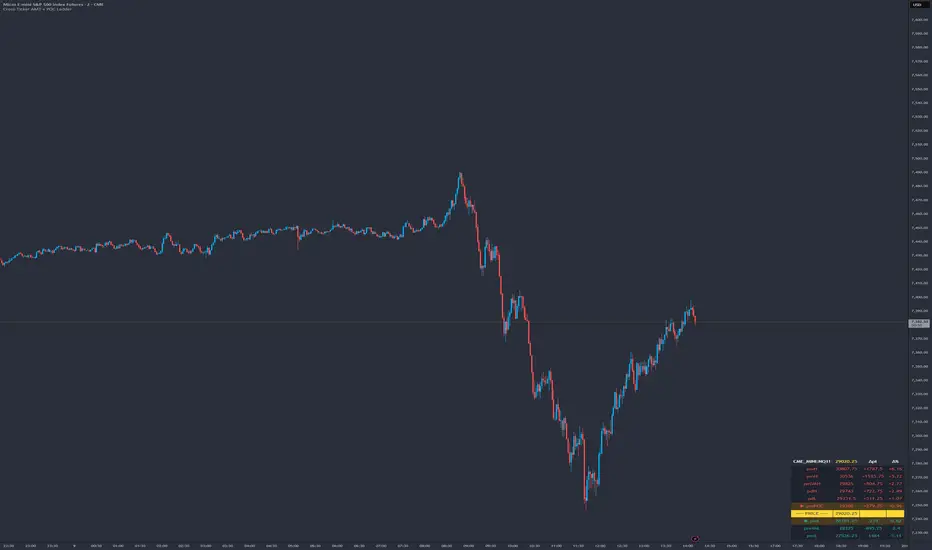
You trade one chart, but you usually care about more than one market. If you are on ES, where NQ sits relative to its own key levels matters, and the reverse is just as true. This indicator puts another symbol's full reference-level stack onto your current chart as a compact price ladder, so you can see at a glance whether the market you are monitoring is pressing into support or resistance, without ever leaving your chart.
Two index futures trade at very different price scales (ES near 5,800, NQ near 20,000), so you cannot plot one symbol's levels as horizontal lines on the other's chart, they would land off screen. The ladder solves this by showing the monitored symbol's levels, its live price, and the distance to every level in both points and percent inside a table.
WHAT IT SHOWS
pdH / pdL: prior day high and low (RTH session)
OVN H / OVN L: overnight (Globex) session high and low
pwH / pwL: prior week high and low
pmH / pmL: prior month high and low
pdPOC, pwPOC, pmPOC: prior day, week, and month volume Point of Control
pmVAH / pmVAL: prior month Value Area High and Low
dPOC / wPOC / mPOC: developing day, week, and month POC (optional)
The ladder is sorted high to low with a PRICE marker inserted at the monitored symbol's current price. Levels above price read as resistance, levels below read as support, and the nearest level on each side is highlighted so the next decision point is obvious.
VOLUME PROFILE METHOD
POC and Value Area are calculated from a binned volume profile of the monitored symbol, not estimated. The prior month POC, VAH, and VAL use a dedicated engine that distributes each bar's volume across its high to low range into fixed price rows, then expands the value area outward from the POC until the chosen percentage of total volume is enclosed (default 68 percent). Row size, value area percent, and the calculation timeframe are all adjustable so you can match the profile resolution you use elsewhere.
A High Volatility Mode is included for wide-range instruments. When enabled it builds the prior month profile from coarser bars and widens the row size, which is lighter on TradingView's calculation budget. Turn it on for products like NQ, or if the prior month values come up blank or the script is slow to load.
SETTINGS
Monitored symbol, RTH session, and overnight session
Individual on/off toggle for every level
Profile row size, value area percent, RTH-only vs full session, and High Volatility Mode
Full control over colors, cell and header backgrounds, text size, decimals, and table position
Proximity threshold (percent) used for highlighting and alerts
ALERTS
Named conditions fire when the monitored symbol comes within your threshold of its nearest resistance, nearest support, or any level. A dynamic alert that names the exact level it is approaching is also available.
NOTES AND LIMITATIONS
Highs and lows are exact. POC and Value Area depend on profile resolution and row size, so set the row size to suit the monitored symbol (for example a finer row for ES, a coarser row for NQ).
Prior week and month levels populate once enough history is loaded. On very low timeframes you may need to load more bars before they appear.
This is a context tool. The monitored market tagging one of its levels only informs your chart to the degree the two instruments are tracking together. On divergent sessions, weight it accordingly.
Add the indicator more than once to monitor several symbols at the same time, each instance is independent.
This script is provided for education and market analysis only. It is not financial advice, and nothing here is a guarantee of any result. Trade your own plan and manage your own risk.
OVERVIEW
You trade one chart, but you usually care about more than one market. If you are on ES, where NQ sits relative to its own key levels matters, and the reverse is just as true. This indicator puts another symbol's full reference-level stack onto your current chart as a compact price ladder, so you can see at a glance whether the market you are monitoring is pressing into support or resistance, without ever leaving your chart.
Two index futures trade at very different price scales (ES near 5,800, NQ near 20,000), so you cannot plot one symbol's levels as horizontal lines on the other's chart, they would land off screen. The ladder solves this by showing the monitored symbol's levels, its live price, and the distance to every level in both points and percent inside a table.
WHAT IT SHOWS
pdH / pdL: prior day high and low (RTH session)
OVN H / OVN L: overnight (Globex) session high and low
pwH / pwL: prior week high and low
pmH / pmL: prior month high and low
pdPOC, pwPOC, pmPOC: prior day, week, and month volume Point of Control
pmVAH / pmVAL: prior month Value Area High and Low
dPOC / wPOC / mPOC: developing day, week, and month POC (optional)
The ladder is sorted high to low with a PRICE marker inserted at the monitored symbol's current price. Levels above price read as resistance, levels below read as support, and the nearest level on each side is highlighted so the next decision point is obvious.
VOLUME PROFILE METHOD
POC and Value Area are calculated from a binned volume profile of the monitored symbol, not estimated. The prior month POC, VAH, and VAL use a dedicated engine that distributes each bar's volume across its high to low range into fixed price rows, then expands the value area outward from the POC until the chosen percentage of total volume is enclosed (default 68 percent). Row size, value area percent, and the calculation timeframe are all adjustable so you can match the profile resolution you use elsewhere.
A High Volatility Mode is included for wide-range instruments. When enabled it builds the prior month profile from coarser bars and widens the row size, which is lighter on TradingView's calculation budget. Turn it on for products like NQ, or if the prior month values come up blank or the script is slow to load.
SETTINGS
Monitored symbol, RTH session, and overnight session
Individual on/off toggle for every level
Profile row size, value area percent, RTH-only vs full session, and High Volatility Mode
Full control over colors, cell and header backgrounds, text size, decimals, and table position
Proximity threshold (percent) used for highlighting and alerts
ALERTS
Named conditions fire when the monitored symbol comes within your threshold of its nearest resistance, nearest support, or any level. A dynamic alert that names the exact level it is approaching is also available.
NOTES AND LIMITATIONS
Highs and lows are exact. POC and Value Area depend on profile resolution and row size, so set the row size to suit the monitored symbol (for example a finer row for ES, a coarser row for NQ).
Prior week and month levels populate once enough history is loaded. On very low timeframes you may need to load more bars before they appear.
This is a context tool. The monitored market tagging one of its levels only informs your chart to the degree the two instruments are tracking together. On divergent sessions, weight it accordingly.
Add the indicator more than once to monitor several symbols at the same time, each instance is independent.
This script is provided for education and market analysis only. It is not financial advice, and nothing here is a guarantee of any result. Trade your own plan and manage your own risk.
Notes de version
Fixed: prior-week and prior-month levels on continuous contractsPrior-week, prior-month, and prior-month profile levels (pmH/pmL, pwH/pwL, pmPOC/pmVAH/pmVAL) could read in the wrong price scale on continuous symbols like NQ1! and ES1!. On quarterly contract rolls, TradingView splices the new contract in without back-adjusting history, leaving a price gap. Any level spanning the roll inherited the old contract's prices, throwing it off by the roll spread (often 250+ points). Prior-day and intraday levels were never affected.
New: "Back-adjust continuous contract" toggle (Symbol & Sessions, default ON). Removes the roll gap so every level reads in the current contract's price scale. Works automatically on all future rolls, no manual updates needed.
Note: if you monitor an explicit contract (e.g. NQU2025) instead of NQ1!, the toggle has no effect and you can leave it on.
Heads up: back-adjusted prior-month profile levels will step on roll day. That's expected, not a glitch.
Script open-source
Dans l'esprit TradingView, le créateur de ce script l'a rendu open source afin que les traders puissent examiner et vérifier ses fonctionnalités. Bravo à l'auteur! Bien que vous puissiez l'utiliser gratuitement, n'oubliez pas que la republication du code est soumise à nos Règles.

Tatanka Trading | Auction Market Theory tools for futures
Clause de non-responsabilité
Les informations et publications ne sont pas destinées à être, et ne constituent pas, des conseils ou recommandations financiers, d'investissement, de trading ou autres fournis ou approuvés par TradingView. Pour en savoir plus, consultez les Conditions d'utilisation.
Script open-source
Dans l'esprit TradingView, le créateur de ce script l'a rendu open source afin que les traders puissent examiner et vérifier ses fonctionnalités. Bravo à l'auteur! Bien que vous puissiez l'utiliser gratuitement, n'oubliez pas que la republication du code est soumise à nos Règles.
Tatanka Trading | Auction Market Theory tools for futures
Clause de non-responsabilité
Les informations et publications ne sont pas destinées à être, et ne constituent pas, des conseils ou recommandations financiers, d'investissement, de trading ou autres fournis ou approuvés par TradingView. Pour en savoir plus, consultez les Conditions d'utilisation.