Gravity Model overlay
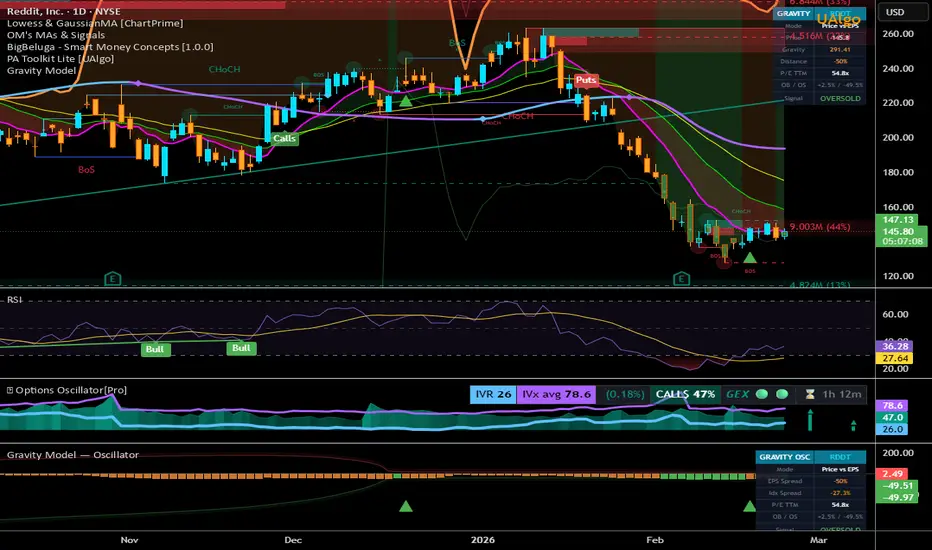
Gravity Model — Overlay
Indicator that projects a "gravity line" on chart — the fair value of price based on earnings growth rate (EPS TTM). Concept: if price perfectly tracked profit growth, it would sit on the gravity line. When it deviates significantly → mean reversion.
What it displays:
Gravity line (orange) — where price should be if it tracked earnings growth
OB/OS bands — dynamic bands based on mean ± 1.2σ of historical deviation
Fill color — cyan above gravity, orange below; intense red in OB, intense green in OS
Arrows — sell signal on OB exit, buy signal on OS exit
Info table — price, gravity, distance %, P/E, signal
3 modes: Price vs EPS, Price vs Index, Both.
Logic: gravity = price_N_bars_ago * (current_EPS / EPS_N_bars_ago), spread = % deviation from gravity. Earnings act as fundamental anchor, price oscillates around it like a pendulum.
Indicator that projects a "gravity line" on chart — the fair value of price based on earnings growth rate (EPS TTM). Concept: if price perfectly tracked profit growth, it would sit on the gravity line. When it deviates significantly → mean reversion.
What it displays:
Gravity line (orange) — where price should be if it tracked earnings growth
OB/OS bands — dynamic bands based on mean ± 1.2σ of historical deviation
Fill color — cyan above gravity, orange below; intense red in OB, intense green in OS
Arrows — sell signal on OB exit, buy signal on OS exit
Info table — price, gravity, distance %, P/E, signal
3 modes: Price vs EPS, Price vs Index, Both.
Logic: gravity = price_N_bars_ago * (current_EPS / EPS_N_bars_ago), spread = % deviation from gravity. Earnings act as fundamental anchor, price oscillates around it like a pendulum.

Clause de non-responsabilité
Les informations et publications ne sont pas destinées à être, et ne constituent pas, des conseils ou recommandations financiers, d'investissement, de trading ou autres fournis ou approuvés par TradingView. Pour en savoir plus, consultez les Conditions d'utilisation.
Clause de non-responsabilité
Les informations et publications ne sont pas destinées à être, et ne constituent pas, des conseils ou recommandations financiers, d'investissement, de trading ou autres fournis ou approuvés par TradingView. Pour en savoir plus, consultez les Conditions d'utilisation.