OPEN-SOURCE SCRIPT
Smart Money Volume [JoeyWave]
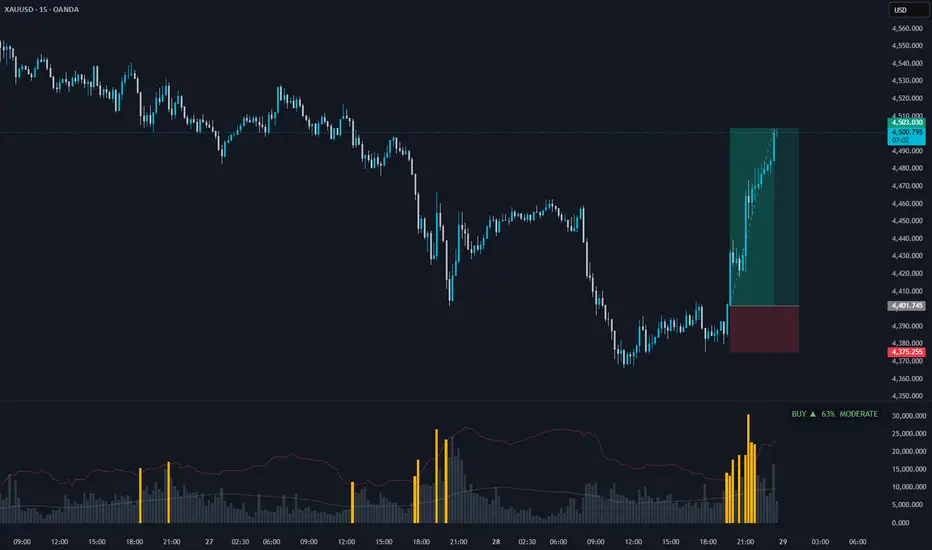
Smart Money Volume highlights statistically abnormal volume bars and quantifies real-time buy/sell pressure using two well-established methods from quantitative finance.
═══════════════════════════════
WHAT IT DOES
═══════════════════════════════
• Volume Panel — amber bars mark statistical outliers detected via Tukey's IQR method
• Pressure HUD (top-right) — shows current dominant side (BUY / SELL), pressure magnitude (%), and strength (WEAK / MODERATE / STRONG)
═══════════════════════════════
METHODOLOGY
═══════════════════════════════
1. Outlier Detection — Tukey's Interquartile Range
threshold = Q3 + k × (Q3 − Q1)
Default k = 2.0 ("extreme outlier" by Tukey's standard). This is robust to skewed volume distributions where mean/std-based methods fail.
2. Buy/Sell Classification — Bulk Volume Classification (BVC)
Based on Easley, López de Prado, O'Hara (2012). Each bar's volume is split into buy/sell proportions using the normalized log-return:
buy_fraction ≈ Φ(log_return / σ)
where Φ is the standard normal CDF, approximated with a logistic function.
3. Aggregated Pressure
Weighted buy and sell volumes are summed over the lookback window (default 20 bars). Pressure = buy_volume / total_volume.
═══════════════════════════════
HOW TO READ
═══════════════════════════════
• Amber bars → unusual volume activity worth investigating
• HUD BUY ▲ → buyers dominant; check % for conviction
• HUD SELL ▼ → sellers dominant
• STRONG ≥ 65% → high conviction
• MODERATE ≥ 55% → moderate
• WEAK < 55% → indecisive, near equilibrium
═══════════════════════════════
HOW TO USE
═══════════════════════════════
• Confluence tool — confirm breakouts, reversals, or trend continuation when an outlier aligns with your setup
• Pressure HUD as a regime filter — only take long setups when HUD shows BUY MODERATE+, shorts when SELL MODERATE+
• Look for divergences — price making new highs while pressure flips to SELL is a classic exhaustion signal
═══════════════════════════════
SETTINGS
═══════════════════════════════
• IQR Lookback — bars used for percentile calculation (default 50)
• IQR Multiplier — 1.5 = standard outlier, 2.0 = extreme (default)
• BVC Sigma Window — return volatility window (default 50)
• Pressure Lookback — bars aggregated for the HUD (default 20)
═══════════════════════════════
REFERENCES
═══════════════════════════════
Easley, D., López de Prado, M., O'Hara, M. (2012) — "Flow Toxicity and Liquidity in a High Frequency World." Review of Financial Studies.
Tukey, J. W. (1977) — "Exploratory Data Analysis." Addison-Wesley.
═══════════════════════════════
Works on any symbol and timeframe with available volume data. Tested on FX (OANDA tick volume), futures, indices, and crypto.
Author: JoeyWave
═══════════════════════════════
WHAT IT DOES
═══════════════════════════════
• Volume Panel — amber bars mark statistical outliers detected via Tukey's IQR method
• Pressure HUD (top-right) — shows current dominant side (BUY / SELL), pressure magnitude (%), and strength (WEAK / MODERATE / STRONG)
═══════════════════════════════
METHODOLOGY
═══════════════════════════════
1. Outlier Detection — Tukey's Interquartile Range
threshold = Q3 + k × (Q3 − Q1)
Default k = 2.0 ("extreme outlier" by Tukey's standard). This is robust to skewed volume distributions where mean/std-based methods fail.
2. Buy/Sell Classification — Bulk Volume Classification (BVC)
Based on Easley, López de Prado, O'Hara (2012). Each bar's volume is split into buy/sell proportions using the normalized log-return:
buy_fraction ≈ Φ(log_return / σ)
where Φ is the standard normal CDF, approximated with a logistic function.
3. Aggregated Pressure
Weighted buy and sell volumes are summed over the lookback window (default 20 bars). Pressure = buy_volume / total_volume.
═══════════════════════════════
HOW TO READ
═══════════════════════════════
• Amber bars → unusual volume activity worth investigating
• HUD BUY ▲ → buyers dominant; check % for conviction
• HUD SELL ▼ → sellers dominant
• STRONG ≥ 65% → high conviction
• MODERATE ≥ 55% → moderate
• WEAK < 55% → indecisive, near equilibrium
═══════════════════════════════
HOW TO USE
═══════════════════════════════
• Confluence tool — confirm breakouts, reversals, or trend continuation when an outlier aligns with your setup
• Pressure HUD as a regime filter — only take long setups when HUD shows BUY MODERATE+, shorts when SELL MODERATE+
• Look for divergences — price making new highs while pressure flips to SELL is a classic exhaustion signal
═══════════════════════════════
SETTINGS
═══════════════════════════════
• IQR Lookback — bars used for percentile calculation (default 50)
• IQR Multiplier — 1.5 = standard outlier, 2.0 = extreme (default)
• BVC Sigma Window — return volatility window (default 50)
• Pressure Lookback — bars aggregated for the HUD (default 20)
═══════════════════════════════
REFERENCES
═══════════════════════════════
Easley, D., López de Prado, M., O'Hara, M. (2012) — "Flow Toxicity and Liquidity in a High Frequency World." Review of Financial Studies.
Tukey, J. W. (1977) — "Exploratory Data Analysis." Addison-Wesley.
═══════════════════════════════
Works on any symbol and timeframe with available volume data. Tested on FX (OANDA tick volume), futures, indices, and crypto.
Author: JoeyWave
Script open-source
Dans l'esprit TradingView, le créateur de ce script l'a rendu open source afin que les traders puissent examiner et vérifier ses fonctionnalités. Bravo à l'auteur! Bien que vous puissiez l'utiliser gratuitement, n'oubliez pas que la republication du code est soumise à nos Règles.

Clause de non-responsabilité
Les informations et publications ne sont pas destinées à être, et ne constituent pas, des conseils ou recommandations financiers, d'investissement, de trading ou autres fournis ou approuvés par TradingView. Pour en savoir plus, consultez les Conditions d'utilisation.
Script open-source
Dans l'esprit TradingView, le créateur de ce script l'a rendu open source afin que les traders puissent examiner et vérifier ses fonctionnalités. Bravo à l'auteur! Bien que vous puissiez l'utiliser gratuitement, n'oubliez pas que la republication du code est soumise à nos Règles.
Clause de non-responsabilité
Les informations et publications ne sont pas destinées à être, et ne constituent pas, des conseils ou recommandations financiers, d'investissement, de trading ou autres fournis ou approuvés par TradingView. Pour en savoir plus, consultez les Conditions d'utilisation.