Mis à jour
Option Strategy P&L Tracker: Multi-Leg with SL & Re-entry
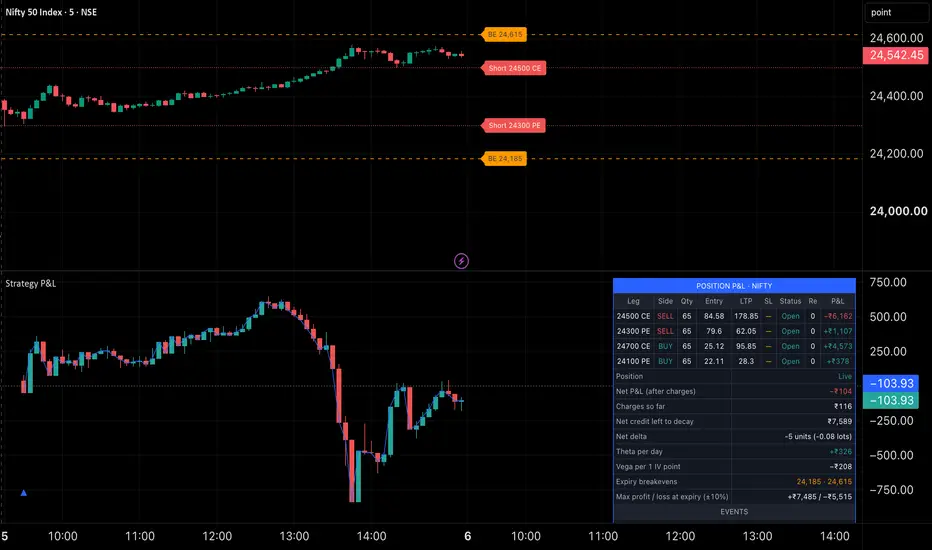
Option Strategy P&L Tracker turns an options position of up to four legs into its own candle chart, and tracks it minute by minute with stop-losses, re-entries and position-level exits. It answers a question that is hard to see on a normal price chart: how is my whole position doing right now, and what happens to it if a leg is stopped out?
HOW IT WORKS
Each leg is an individual option contract that you choose. From the entry time you set, the script steps through every leg on 1-minute data inside each chart bar, so stop-losses, re-entries and exits are timed to the minute even on 5- or 15-minute charts.
For every minute it:
• opens each leg at its entry price (the leg's price at the entry minute, or a price you type in), adjusted for slippage
• checks each leg's stop-loss against that minute's high or low; if the market gaps through the stop, the fill is taken at the open
• optionally trails the stop-loss in steps as the leg moves in your favour
• handles re-entries after a stop-loss
• adds up realised and open P&L across all legs, net of estimated charges
• checks position-level rules: overall stop-loss, overall target, profit lock, and intraday square-off
The combined net P&L is plotted as candles in a separate pane, with markers for entries, stop-losses, re-entries and the final exit.
RE-ENTRY MODES (per leg)
• RE-ASAP: re-enters on the next minute after the stop-loss, same direction
• RE-ASAP ↩: as above, in the opposite direction
• RE-COST: re-enters when the premium returns to that trade's entry price
• RE-COST ↩: as above, in the opposite direction
The "max" setting limits how many re-entries a leg can take.
WHAT YOU SEE
P&L pane: net position P&L as candles, with event markers.
Price chart: short strikes and the expiry breakevens of the open position.
Table:
• each leg's side, quantity, entry, last price, current stop-loss, status, re-entry count and P&L
• net P&L after charges, and charges so far
• net credit left to decay (or net debit at risk), counting both short and long legs
• net delta, theta per day and vega per IV point, from Black-Scholes using each leg's implied volatility backed out of its own premium
• expiry breakevens and the maximum profit and loss at expiry within the chosen price range, calculated exactly at each strike
• a log of the most recent events with their times
HOW TO USE
1. Open the chart of the underlying index (for example NIFTY) on a 1- to 15-minute timeframe.
2. Add the script. It asks you to pick Leg 1's contract and to click the bar where the position was entered.
3. In the settings, pick up to three more contracts. Clicking a Contract box opens the symbol search, where you can select the option. Strike, call/put and expiry are read from the contract's ticker.
4. For each leg, set the side, lots, entry price (0 = use the market price at the entry minute), stop-loss and re-entry mode.
5. Optionally set the trailing stop, the position stop-loss, target, profit lock, square-off time, slippage and charge rates.
6. For notifications, create an alert with the condition "Any alert() function call". It reports entries, stop-losses, re-entries and exits, at most once per chart bar.
The publication chart shows an example iron condor with manually entered entry prices, for illustration.
LIMITATIONS
• This is a calculation from market data. Fills are simulated; results will differ from your broker's P&L.
• Within each minute the exact price path is unknown. The script checks the stop-loss first, which is the conservative assumption.
• Position-level rules are checked on each 1-minute close.
• Lot size and charge rates are editable estimates. Verify them against your contract notes and the exchange's current lot size.
• Strike, type and expiry are read from tickers in the format ROOT + YYMMDD + C/P + strike. Greeks and breakevens are skipped for any leg whose ticker cannot be read this way.
• Greeks use the Black-Scholes model and an editable risk-free rate. They are estimates.
• Values follow the data your account can access, real-time or delayed.
This is an educational tool for studying and monitoring option positions. It does not place orders and does not give trade recommendations.
HOW IT WORKS
Each leg is an individual option contract that you choose. From the entry time you set, the script steps through every leg on 1-minute data inside each chart bar, so stop-losses, re-entries and exits are timed to the minute even on 5- or 15-minute charts.
For every minute it:
• opens each leg at its entry price (the leg's price at the entry minute, or a price you type in), adjusted for slippage
• checks each leg's stop-loss against that minute's high or low; if the market gaps through the stop, the fill is taken at the open
• optionally trails the stop-loss in steps as the leg moves in your favour
• handles re-entries after a stop-loss
• adds up realised and open P&L across all legs, net of estimated charges
• checks position-level rules: overall stop-loss, overall target, profit lock, and intraday square-off
The combined net P&L is plotted as candles in a separate pane, with markers for entries, stop-losses, re-entries and the final exit.
RE-ENTRY MODES (per leg)
• RE-ASAP: re-enters on the next minute after the stop-loss, same direction
• RE-ASAP ↩: as above, in the opposite direction
• RE-COST: re-enters when the premium returns to that trade's entry price
• RE-COST ↩: as above, in the opposite direction
The "max" setting limits how many re-entries a leg can take.
WHAT YOU SEE
P&L pane: net position P&L as candles, with event markers.
Price chart: short strikes and the expiry breakevens of the open position.
Table:
• each leg's side, quantity, entry, last price, current stop-loss, status, re-entry count and P&L
• net P&L after charges, and charges so far
• net credit left to decay (or net debit at risk), counting both short and long legs
• net delta, theta per day and vega per IV point, from Black-Scholes using each leg's implied volatility backed out of its own premium
• expiry breakevens and the maximum profit and loss at expiry within the chosen price range, calculated exactly at each strike
• a log of the most recent events with their times
HOW TO USE
1. Open the chart of the underlying index (for example NIFTY) on a 1- to 15-minute timeframe.
2. Add the script. It asks you to pick Leg 1's contract and to click the bar where the position was entered.
3. In the settings, pick up to three more contracts. Clicking a Contract box opens the symbol search, where you can select the option. Strike, call/put and expiry are read from the contract's ticker.
4. For each leg, set the side, lots, entry price (0 = use the market price at the entry minute), stop-loss and re-entry mode.
5. Optionally set the trailing stop, the position stop-loss, target, profit lock, square-off time, slippage and charge rates.
6. For notifications, create an alert with the condition "Any alert() function call". It reports entries, stop-losses, re-entries and exits, at most once per chart bar.
The publication chart shows an example iron condor with manually entered entry prices, for illustration.
LIMITATIONS
• This is a calculation from market data. Fills are simulated; results will differ from your broker's P&L.
• Within each minute the exact price path is unknown. The script checks the stop-loss first, which is the conservative assumption.
• Position-level rules are checked on each 1-minute close.
• Lot size and charge rates are editable estimates. Verify them against your contract notes and the exchange's current lot size.
• Strike, type and expiry are read from tickers in the format ROOT + YYMMDD + C/P + strike. Greeks and breakevens are skipped for any leg whose ticker cannot be read this way.
• Greeks use the Black-Scholes model and an editable risk-free rate. They are estimates.
• Values follow the data your account can access, real-time or delayed.
This is an educational tool for studying and monitoring option positions. It does not place orders and does not give trade recommendations.
Notes de version
Fixed: on a chart kept open during the live session, stop-loss and re-entry checks could differ from the same chart reloaded later. Each completed 1-minute bar is now processed exactly once, so live and historical results match on every timeframe. Live P&L still updates every tick; stop-loss and re-entry decisions are taken when each 1-minute bar closes. The status row now shows "All legs closed" when every leg has exited.
Clause de non-responsabilité
Les informations et publications ne sont pas destinées à être, et ne constituent pas, des conseils ou recommandations financiers, d'investissement, de trading ou autres fournis ou approuvés par TradingView. Pour en savoir plus, consultez les Conditions d'utilisation.
Clause de non-responsabilité
Les informations et publications ne sont pas destinées à être, et ne constituent pas, des conseils ou recommandations financiers, d'investissement, de trading ou autres fournis ou approuvés par TradingView. Pour en savoir plus, consultez les Conditions d'utilisation.