Mis à jour
Osprey Pivots
OVERVIEW
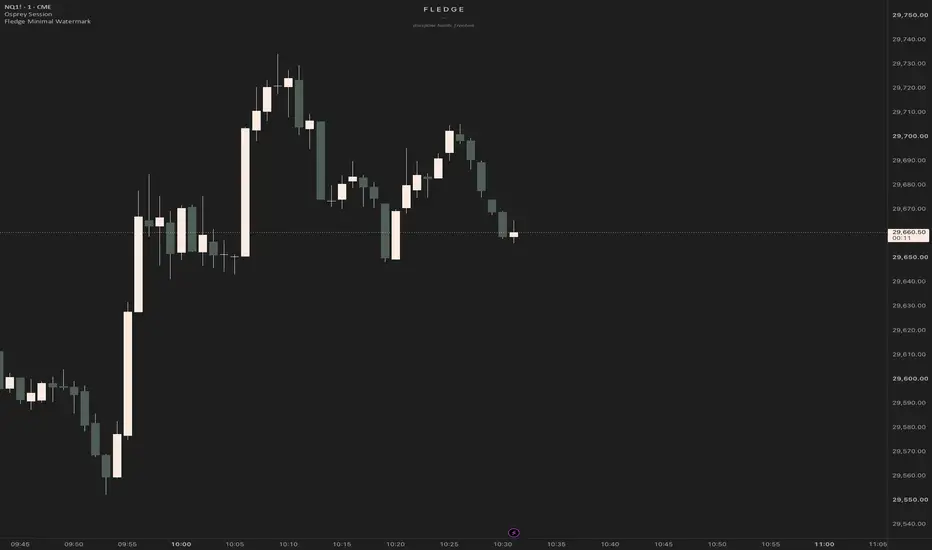
Osprey Pivots marks swing highs and swing lows based on candle direction and a price gap, instead of a fixed left/right bar lookback. It was designed for 1-minute charts but works on any timeframe and symbol. Use it on standard candlestick or bar charts.
HOW IT WORKS
A swing low "leg" can only start on a bearish candle (close < open). From there the script tracks the lowest low. If a following candle (of any color) trades lower, the running low moves to that candle. As soon as a candle closes without touching the running low, leaving a gap of at least the chosen number of ticks, that low is confirmed as the last swing low.
A swing high leg works the same way in reverse: it can only start on a bullish candle (close > open), it tracks the highest high, and it is confirmed when a candle fails to reach that high.
If no bearish candle is involved, no swing low is created (and vice versa for highs). For example, a bullish candle followed by a gap and another bullish candle confirms a high but not a low.
WHY IT IS DIFFERENT
Classic pivot functions (such as ta.pivothigh / ta.pivotlow) need a fixed number of bars on both sides, which delays the signal and ignores candle direction. This script confirms a swing as soon as price leaves a gap from the extreme, and it requires that the move started with a candle in the matching direction. The result is a faster, structure-based reading of where the last meaningful high and low are.
HOW TO USE
- The thick lines show the last confirmed high and low, extended to the right. They can be used as reference levels for structure, breaks and liquidity.
- Optionally, enable "Extend each pivot until broken" to keep every untouched pivot level on the chart; each line stops on the bar that trades through it.
- Alerts are available for "New High" and "New Low".
SETTINGS
- Minimum gap (ticks): how far a candle must stay away from the extreme to confirm it. 1 = it simply must not touch it. Increase it to filter out tiny gaps.
- Mark all pivots: shows a small triangle on every confirmed pivot.
- Show last High / Low line: shows the most recent confirmed levels.
- Extend each pivot until broken: draws a dotted line from each pivot until price breaks it.
- High color / Low color.
NOTES
- Pivots are confirmed only on bar close, so the script does not repaint. A pivot is drawn on the candle that made the extreme, one or more bars after it formed.
- Doji candles (close = open) never start a leg, but they can confirm one.
- This tool describes price structure only. It does not predict future price movement and is not a trading signal on its own.
Osprey Pivots marks swing highs and swing lows based on candle direction and a price gap, instead of a fixed left/right bar lookback. It was designed for 1-minute charts but works on any timeframe and symbol. Use it on standard candlestick or bar charts.
HOW IT WORKS
A swing low "leg" can only start on a bearish candle (close < open). From there the script tracks the lowest low. If a following candle (of any color) trades lower, the running low moves to that candle. As soon as a candle closes without touching the running low, leaving a gap of at least the chosen number of ticks, that low is confirmed as the last swing low.
A swing high leg works the same way in reverse: it can only start on a bullish candle (close > open), it tracks the highest high, and it is confirmed when a candle fails to reach that high.
If no bearish candle is involved, no swing low is created (and vice versa for highs). For example, a bullish candle followed by a gap and another bullish candle confirms a high but not a low.
WHY IT IS DIFFERENT
Classic pivot functions (such as ta.pivothigh / ta.pivotlow) need a fixed number of bars on both sides, which delays the signal and ignores candle direction. This script confirms a swing as soon as price leaves a gap from the extreme, and it requires that the move started with a candle in the matching direction. The result is a faster, structure-based reading of where the last meaningful high and low are.
HOW TO USE
- The thick lines show the last confirmed high and low, extended to the right. They can be used as reference levels for structure, breaks and liquidity.
- Optionally, enable "Extend each pivot until broken" to keep every untouched pivot level on the chart; each line stops on the bar that trades through it.
- Alerts are available for "New High" and "New Low".
SETTINGS
- Minimum gap (ticks): how far a candle must stay away from the extreme to confirm it. 1 = it simply must not touch it. Increase it to filter out tiny gaps.
- Mark all pivots: shows a small triangle on every confirmed pivot.
- Show last High / Low line: shows the most recent confirmed levels.
- Extend each pivot until broken: draws a dotted line from each pivot until price breaks it.
- High color / Low color.
NOTES
- Pivots are confirmed only on bar close, so the script does not repaint. A pivot is drawn on the candle that made the extreme, one or more bars after it formed.
- Doji candles (close = open) never start a leg, but they can confirm one.
- This tool describes price structure only. It does not predict future price movement and is not a trading signal on its own.
Notes de version
- Added full marker customization, set separately for highs and lows: shape (triangle, arrow, circle, square, diamond, cross, x-cross, flag, label, text only), color, position (above/below bar or at price) and optional text.- Added a Custom marker size in points, allowing markers smaller than the Tiny preset.
- Added color, width and style settings for the last High/Low lines and the pivot rays.
- Settings are now grouped (Logic, High marker, Low marker, Lines).
- Pivot logic is unchanged.

Clause de non-responsabilité
Les informations et publications ne sont pas destinées à être, et ne constituent pas, des conseils ou recommandations financiers, d'investissement, de trading ou autres fournis ou approuvés par TradingView. Pour en savoir plus, consultez les Conditions d'utilisation.
Clause de non-responsabilité
Les informations et publications ne sont pas destinées à être, et ne constituent pas, des conseils ou recommandations financiers, d'investissement, de trading ou autres fournis ou approuvés par TradingView. Pour en savoir plus, consultez les Conditions d'utilisation.