OPEN-SOURCE SCRIPT
Trend Intelligence System
What This Indicator Does
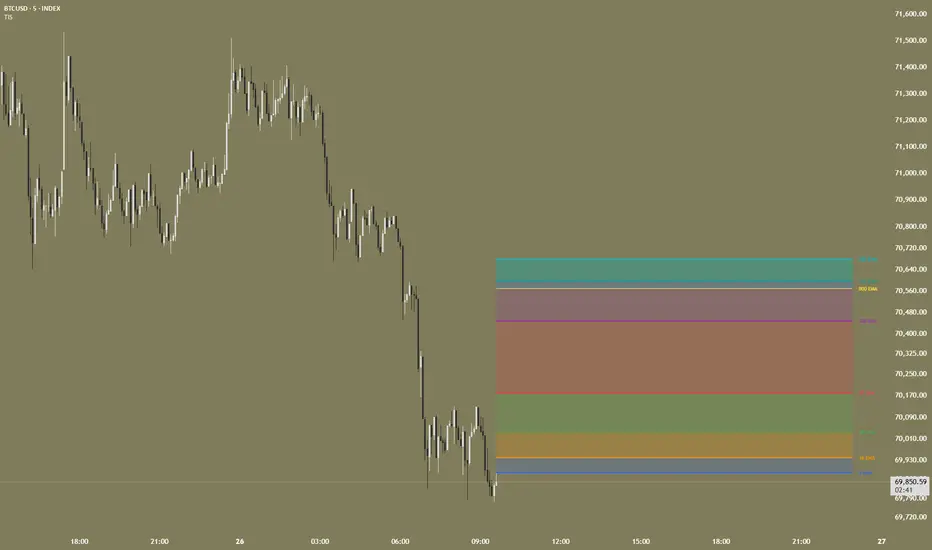
The Trend Intelligence System transforms a traditional multi-MA ribbon into an analytical framework that quantifies trend strength across multiple timeframe layers. Rather than simply displaying Moving Averages and leaving interpretation to visual analysis, this system calculates objective metrics that answer key questions: How aligned is the trend across all timeframes? Where is price relative to the MA structure? Are the MAs compressing (signaling potential breakout)? Where do multiple MAs cluster to form significant levels?
The indicator displays up to eight independently configurable Moving Averages, each capable of pulling data from different timeframes and using different calculation methods. Beyond visualization, it provides a Trend Alignment Score that quantifies momentum direction, a Price Position Score that measures where price sits within the MA structure, and real-time detection of compression and confluence conditions.
How It Works
1. Multi-Layer Moving Average System
Eight Moving Averages are available, each with independent configuration for Length, Type (SMA, EMA, RMA, WMA, HMA, VWMA), and Timeframe. The default configuration spans from 8 EMA (fast momentum) to 800 EMA (secular trend), providing complete trend context from scalping to position trading perspectives. Each MA can reference a different timeframe, enabling multi-timeframe analysis on a single chart without switching.
2. Trend Alignment Score Calculation
The system calculates slope direction for each enabled MA by comparing current value to the previous bar's value. The Trend Score formula is:
Trend Score = ((Bullish MAs - Bearish MAs) / Total Enabled MAs) × 100
This produces a score from -100 (all MAs falling) to +100 (all MAs rising). Scores above +50 indicate strong bullish alignment; below -50 indicates strong bearish alignment. The score crossing zero signals momentum transition.
3. Price Position Analysis
The indicator counts how many MAs price is currently above versus below:
Position Score = (MAs Price is Above / Total Enabled MAs) × 100
A score of 100% means price is above all MAs (fully bullish positioning); 0% means price is below all MAs (fully bearish positioning). This metric helps identify overextension and potential mean reversion setups.
4. Compression Detection
Compression occurs when all MAs converge to similar price levels, often preceding significant breakouts. The system measures:
Spread % = ((Highest MA - Lowest MA) / Current Price) × 100
When Spread % falls below the user-defined threshold (default 1.0%), compression is detected and the background highlights. Traders use compression as a setup indicator, preparing for directional breakouts when the MAs begin expanding.
5. Confluence Detection
The system identifies price levels where multiple MAs cluster together. These zones often act as powerful support/resistance because they represent agreement across multiple timeframes. The algorithm calculates median MA value and counts how many MAs fall within the threshold percentage, flagging confluence when the minimum MA count is reached.
6. Dynamic Slope Coloring (Disabled by Default)
When enabled, each MA line changes color based on its direction: rising MAs show bullish color, falling MAs show bearish color. This transforms the ribbon from a static display into a dynamic momentum map.
7. Dynamic Zone Coloring (Disabled by Default)
When enabled, the filled zones between MAs change color based on both boundary MAs. Both rising shows bullish color, both falling shows bearish color, and mixed directions show neutral color. This immediately visualizes where trend agreement exists versus where conflict occurs.
8. Crossover Detection (Disabled by Default)
The system monitors for Golden Cross (50-period MA crosses above 200-period MA), Death Cross (opposite), and general crossovers where any faster MA crosses any slower MA.
How to Use This Indicator
For Trend Identification: Monitor the Trend Score on the dashboard. Scores above +50 suggest trading with bullish bias; scores below -50 suggest bearish bias. The "FULL BULL" or "FULL BEAR" alignment status indicates strongest trend conditions.
For Breakout Trading: Enable Compression Detection. When "COMPRESSED" appears and background highlights, prepare for a breakout. Enter in the direction of the subsequent expansion.
For Support/Resistance Analysis: Enable Confluence Detection. When multiple MAs cluster, these levels often provide strong reaction points. The confluence zone is highlighted on the chart.
For Multi-Timeframe Analysis: Configure different MAs to pull from different timeframes. Set MA7 and MA8 to use the Daily timeframe while on a 1-hour chart for higher timeframe context.
For Momentum Shifts: Enable MA Crossovers. Small circles mark momentum shifts when faster MAs cross slower ones.
Dashboard Interpretation
The dashboard provides at-a-glance analysis showing Trend Score (quantified alignment from -100 to +100), Bullish MAs count, Price Above count, Position Score, MA Spread status (Compressed or Normal), Spread percentage, Confluence status, Trend Bias (Bullish/Bearish/Neutral), and Alignment state (Full Bull/Full Bear/Mixed).
What Makes This Original
While multi-MA ribbons exist, this implementation adds analytical depth through quantified Trend Scoring that transforms subjective visual interpretation into objective measurement, Compression Detection with configurable thresholds that identifies potential breakout setups algorithmically, Confluence Zone Detection that automatically finds where multiple timeframes agree on significant levels, Dynamic Coloring System for real-time slope and zone coloring based on momentum direction, Price Position Scoring that measures where price sits within the entire MA structure, and a comprehensive Alert System with 14 distinct alert conditions for automated monitoring. The combination of visualization and quantification transforms this from a display tool into an analytical framework.
Non-Repainting Behavior
When "Wait for Bar Close" is enabled, all calculations use confirmed bar data only. Signals, scores, and visual elements update only after bars close, ensuring what you see historically is what you would have seen in real-time.
Available Alerts
The indicator includes alerts for Strong Bullish/Bearish Trend (75%+ alignment), Trend Score Zero Crosses (momentum transitions), Price Above/Below All MAs, Compression Detection and Breakout, MA Confluence Zones, Golden Cross and Death Cross, General MA Crossovers, and Full Bullish/Bearish Alignment achieved.
Recommended Settings by Trading Style
Day Trading (5-15 minute charts): MAs 1-4 enabled with lengths 8, 16, 30, 50. Enable Compression Detection with 0.5% threshold.
Swing Trading (1-4 hour charts): All MAs enabled with default lengths. Enable Confluence Detection. Use MA7 and MA8 from Daily timeframe.
Position Trading (Daily charts): Focus on MAs 4-8 (50 to 800). Enable Golden/Death Cross signals.
Scalping (1-3 minute charts): MAs 1-3 only with lengths 5, 10, 20. Enable Dynamic Slope Coloring.
Disclaimer
This indicator is a technical analysis tool designed to assist with trend identification and analysis. It does not predict future price movements and should not be used as the sole basis for trading decisions. Always use proper risk management and consider multiple factors when making trading decisions. This indicator is suitable for all markets including stocks, forex, cryptocurrencies, and futures across all timeframes.
Script open-source
Dans l'esprit TradingView, le créateur de ce script l'a rendu open source afin que les traders puissent examiner et vérifier ses fonctionnalités. Bravo à l'auteur! Bien que vous puissiez l'utiliser gratuitement, n'oubliez pas que la republication du code est soumise à nos Règles.

Clause de non-responsabilité
Les informations et publications ne sont pas destinées à être, et ne constituent pas, des conseils ou recommandations financiers, d'investissement, de trading ou autres fournis ou approuvés par TradingView. Pour en savoir plus, consultez les Conditions d'utilisation.
Script open-source
Dans l'esprit TradingView, le créateur de ce script l'a rendu open source afin que les traders puissent examiner et vérifier ses fonctionnalités. Bravo à l'auteur! Bien que vous puissiez l'utiliser gratuitement, n'oubliez pas que la republication du code est soumise à nos Règles.
Clause de non-responsabilité
Les informations et publications ne sont pas destinées à être, et ne constituent pas, des conseils ou recommandations financiers, d'investissement, de trading ou autres fournis ou approuvés par TradingView. Pour en savoir plus, consultez les Conditions d'utilisation.