OPEN-SOURCE SCRIPT
Aura Trend Momentum [Pineify]
```
Aura Trend Momentum - Advanced Double-Smoothed Oscillator with Gradient Visualization
The Aura Trend Momentum indicator is a sophisticated momentum oscillator that combines double exponential smoothing with normalized momentum calculations to provide clear, noise-filtered trend signals. Unlike traditional momentum oscillators that suffer from erratic movements and false signals, this indicator employs a dual-layer EMA smoothing technique on both the raw momentum and its absolute value, creating a stable, normalized oscillator that ranges between -100 and +100. This approach effectively eliminates market noise while preserving the essential momentum characteristics needed for accurate trend identification.
Key Features
How It Works
The Aura Trend Momentum indicator utilizes a unique three-stage calculation methodology that sets it apart from conventional momentum oscillators:
Stage 1: Momentum Extraction
The indicator begins by calculating the raw price change (momentum) between consecutive bars using the selected source price (default: close). This represents the basic rate of change in the market.
Stage 2: Double Exponential Smoothing
Rather than using a single smoothing pass, the indicator applies two layers of exponential moving average (EMA) smoothing. The first EMA uses the "Trend Length" parameter (default: 21 periods) to capture the primary trend momentum, while the second EMA applies the "Signal Smoothing" parameter (default: 9 periods) to further refine the signal. This same double-smoothing process is applied to both the raw momentum and its absolute value, creating two parallel smoothed datasets.
Stage 3: Normalization and Signal Generation
The smoothed momentum is divided by the smoothed absolute momentum and multiplied by 100, creating a normalized oscillator that always ranges between -100 and +100. This normalization ensures consistent readings regardless of price levels or volatility conditions. A signal line is then generated by applying another EMA smoothing pass to the oscillator, creating a slower-moving reference line for crossover detection.
Trading Ideas and Insights
Momentum Reversal Strategy:
The indicator excels at identifying momentum reversals in optimal zones. Bullish entry signals (green dots) appear when the oscillator crosses above the signal line while in negative territory (below zero), indicating that downward momentum is exhausting and a reversal is beginning. Conversely, bearish entry signals (red dots) trigger when the oscillator crosses below the signal line while in positive territory, signaling that upward momentum is weakening.
Trend Strength Assessment:
The four-color gradient system provides instant visual feedback on trend strength. Strong bullish momentum (bright green) occurs when the oscillator is positive and rising, indicating accelerating upward movement. Weak bullish momentum (light green) appears when the oscillator is positive but declining, suggesting the uptrend is losing steam. The same logic applies inversely for bearish conditions with red and light red colors.
Overbought/Oversold Trading:
The +50 and -50 reference levels serve as overbought and oversold zones. When the oscillator reaches these extremes, it suggests the current momentum may be overextended, potentially leading to mean reversion opportunities. Traders can watch for the oscillator to retreat from these levels as confirmation of momentum exhaustion.
Divergence Detection:
Like other momentum oscillators, Aura Trend Momentum can be used to identify divergences between price action and momentum. A bullish divergence occurs when price makes lower lows while the oscillator makes higher lows, suggesting weakening bearish momentum. Bearish divergences show the opposite pattern, warning of potential trend reversals.
How Multiple Indicators Work Together
The Aura Trend Momentum indicator integrates three distinct technical analysis components into a unified system:
1. Momentum Oscillator Component: At its core, this is a momentum-based oscillator similar to the Rate of Change (ROC) indicator, measuring the speed and magnitude of price movements.
2. Moving Average Smoothing Component: The double EMA smoothing technique borrows from the concept of DEMA (Double Exponential Moving Average), which reduces lag while maintaining smoothness. This component filters out market noise that would otherwise generate false signals.
3. Normalization Component: By dividing smoothed momentum by smoothed absolute momentum, the indicator incorporates a normalization technique similar to the Percentage Price Oscillator (PPO) or normalized RSI, ensuring readings are comparable across different securities and timeframes.
These components work synergistically: the momentum calculation captures market dynamics, the double smoothing eliminates noise without excessive lag, and the normalization ensures universal applicability. The signal line adds a fourth dimension by providing a smoothed reference for timing entry and exit points, similar to how MACD uses a signal line for crossover detection.
Unique Aspects
What distinguishes Aura Trend Momentum from other momentum oscillators is its sophisticated approach to noise reduction and signal clarity. While indicators like RSI, Stochastic, or standard momentum oscillators either sacrifice responsiveness for smoothness or vice versa, this indicator achieves both through its double-smoothing methodology applied to both numerator and denominator of the normalization formula.
The four-color gradient visualization system is another unique feature that goes beyond simple bullish/bearish coloring. By distinguishing between strong and weak states within each trend direction, traders gain immediate insight into momentum acceleration or deceleration without needing to analyze multiple indicators or chart patterns.
Additionally, the smart signal filtering—requiring bullish crosses to occur below zero and bearish crosses above zero—dramatically reduces false signals that plague many oscillator-based systems. This zone-based filtering ensures that signals align with genuine momentum reversals rather than minor fluctuations within an established trend.
How to Use
Customization
The indicator offers flexible customization options to adapt to different trading styles and market conditions:
Oscillator Settings:
Visuals & Colors:
Customize all four gradient colors (Bullish Strong, Bullish Weak, Bearish Strong, Bearish Weak) and the Signal Line color to match your chart theme or personal preferences. The color scheme helps with quick visual pattern recognition during live trading.
Conclusion
The Aura Trend Momentum indicator represents a refined approach to momentum analysis, combining proven technical analysis concepts—momentum calculation, exponential smoothing, and normalization—into a cohesive, noise-filtered system. Its double-smoothing methodology addresses the primary weakness of traditional momentum oscillators (excessive noise) while maintaining the responsiveness needed for timely trade entries. The four-color gradient system and smart signal filtering provide clear, actionable insights that help traders identify high-probability momentum reversals and trend continuation opportunities. Whether you're a day trader seeking precise entry points or a swing trader looking for trend confirmation, this indicator offers the clarity and reliability needed for confident decision-making in dynamic market conditions.
```
Aura Trend Momentum - Advanced Double-Smoothed Oscillator with Gradient Visualization
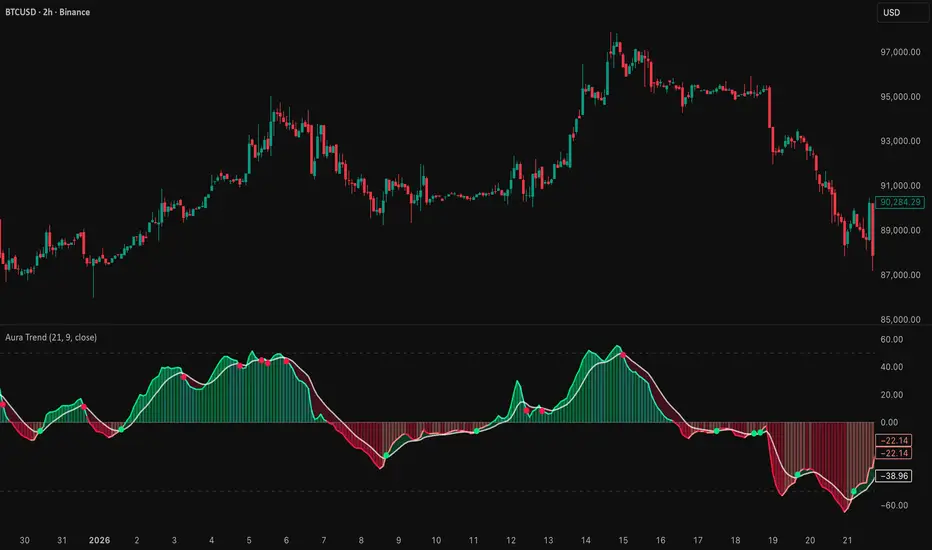
The Aura Trend Momentum indicator is a sophisticated momentum oscillator that combines double exponential smoothing with normalized momentum calculations to provide clear, noise-filtered trend signals. Unlike traditional momentum oscillators that suffer from erratic movements and false signals, this indicator employs a dual-layer EMA smoothing technique on both the raw momentum and its absolute value, creating a stable, normalized oscillator that ranges between -100 and +100. This approach effectively eliminates market noise while preserving the essential momentum characteristics needed for accurate trend identification.
Key Features
- Double-smoothed momentum calculation that significantly reduces false signals and whipsaw trades
- Normalized oscillator output (-100 to +100) for consistent interpretation across all market conditions and timeframes
- Four-color gradient histogram system that visually distinguishes between strong bullish, weak bullish, strong bearish, and weak bearish momentum states
- Signal line with cloud fill visualization showing the relationship between momentum and its smoothed average
- Smart crossover detection that filters signals by requiring reversals to occur in optimal zones (negative territory for bullish signals, positive territory for bearish signals)
- Built-in alert conditions for automated trading notifications and real-time monitoring
- Overbought (+50) and oversold (-50) reference levels with zero-line equilibrium
How It Works
The Aura Trend Momentum indicator utilizes a unique three-stage calculation methodology that sets it apart from conventional momentum oscillators:
Stage 1: Momentum Extraction
The indicator begins by calculating the raw price change (momentum) between consecutive bars using the selected source price (default: close). This represents the basic rate of change in the market.
Stage 2: Double Exponential Smoothing
Rather than using a single smoothing pass, the indicator applies two layers of exponential moving average (EMA) smoothing. The first EMA uses the "Trend Length" parameter (default: 21 periods) to capture the primary trend momentum, while the second EMA applies the "Signal Smoothing" parameter (default: 9 periods) to further refine the signal. This same double-smoothing process is applied to both the raw momentum and its absolute value, creating two parallel smoothed datasets.
Stage 3: Normalization and Signal Generation
The smoothed momentum is divided by the smoothed absolute momentum and multiplied by 100, creating a normalized oscillator that always ranges between -100 and +100. This normalization ensures consistent readings regardless of price levels or volatility conditions. A signal line is then generated by applying another EMA smoothing pass to the oscillator, creating a slower-moving reference line for crossover detection.
Trading Ideas and Insights
Momentum Reversal Strategy:
The indicator excels at identifying momentum reversals in optimal zones. Bullish entry signals (green dots) appear when the oscillator crosses above the signal line while in negative territory (below zero), indicating that downward momentum is exhausting and a reversal is beginning. Conversely, bearish entry signals (red dots) trigger when the oscillator crosses below the signal line while in positive territory, signaling that upward momentum is weakening.
Trend Strength Assessment:
The four-color gradient system provides instant visual feedback on trend strength. Strong bullish momentum (bright green) occurs when the oscillator is positive and rising, indicating accelerating upward movement. Weak bullish momentum (light green) appears when the oscillator is positive but declining, suggesting the uptrend is losing steam. The same logic applies inversely for bearish conditions with red and light red colors.
Overbought/Oversold Trading:
The +50 and -50 reference levels serve as overbought and oversold zones. When the oscillator reaches these extremes, it suggests the current momentum may be overextended, potentially leading to mean reversion opportunities. Traders can watch for the oscillator to retreat from these levels as confirmation of momentum exhaustion.
Divergence Detection:
Like other momentum oscillators, Aura Trend Momentum can be used to identify divergences between price action and momentum. A bullish divergence occurs when price makes lower lows while the oscillator makes higher lows, suggesting weakening bearish momentum. Bearish divergences show the opposite pattern, warning of potential trend reversals.
How Multiple Indicators Work Together
The Aura Trend Momentum indicator integrates three distinct technical analysis components into a unified system:
1. Momentum Oscillator Component: At its core, this is a momentum-based oscillator similar to the Rate of Change (ROC) indicator, measuring the speed and magnitude of price movements.
2. Moving Average Smoothing Component: The double EMA smoothing technique borrows from the concept of DEMA (Double Exponential Moving Average), which reduces lag while maintaining smoothness. This component filters out market noise that would otherwise generate false signals.
3. Normalization Component: By dividing smoothed momentum by smoothed absolute momentum, the indicator incorporates a normalization technique similar to the Percentage Price Oscillator (PPO) or normalized RSI, ensuring readings are comparable across different securities and timeframes.
These components work synergistically: the momentum calculation captures market dynamics, the double smoothing eliminates noise without excessive lag, and the normalization ensures universal applicability. The signal line adds a fourth dimension by providing a smoothed reference for timing entry and exit points, similar to how MACD uses a signal line for crossover detection.
Unique Aspects
What distinguishes Aura Trend Momentum from other momentum oscillators is its sophisticated approach to noise reduction and signal clarity. While indicators like RSI, Stochastic, or standard momentum oscillators either sacrifice responsiveness for smoothness or vice versa, this indicator achieves both through its double-smoothing methodology applied to both numerator and denominator of the normalization formula.
The four-color gradient visualization system is another unique feature that goes beyond simple bullish/bearish coloring. By distinguishing between strong and weak states within each trend direction, traders gain immediate insight into momentum acceleration or deceleration without needing to analyze multiple indicators or chart patterns.
Additionally, the smart signal filtering—requiring bullish crosses to occur below zero and bearish crosses above zero—dramatically reduces false signals that plague many oscillator-based systems. This zone-based filtering ensures that signals align with genuine momentum reversals rather than minor fluctuations within an established trend.
How to Use
- Add the Aura Trend Momentum indicator to your chart from the indicators menu
- The oscillator will appear in a separate pane below your price chart, displaying the histogram, oscillator line, signal line, and cloud fill
- Watch for green dots (bullish entry signals) when the oscillator crosses above the signal line in negative territory—these indicate potential long entry opportunities
- Watch for red dots (bearish entry signals) when the oscillator crosses below the signal line in positive territory—these indicate potential short entry opportunities
- Monitor the histogram colors: bright green indicates strong bullish momentum, light green shows weakening bullish momentum, bright red indicates strong bearish momentum, and light red shows weakening bearish momentum
- Use the +50 level as an overbought reference and -50 as oversold—consider taking profits or tightening stops when these levels are reached
- The cloud fill between the oscillator and signal line provides additional context: green cloud suggests bullish control, red cloud suggests bearish control
- Set up alerts using the built-in alert conditions to receive notifications when buy or sell signals trigger
Customization
The indicator offers flexible customization options to adapt to different trading styles and market conditions:
Oscillator Settings:
- Trend Length (default: 21): Controls the primary lookback period for momentum calculation. Increase for longer-term trend analysis (30-50), decrease for shorter-term trading (10-15)
- Signal Smoothing (default: 9): Adjusts the smoothing applied to both the oscillator and signal line. Higher values create smoother signals with fewer crossovers, lower values increase responsiveness
- Source (default: close): Select which price data to use for calculations—close, open, high, low, or various price averages like HL2 or HLC3
Visuals & Colors:
Customize all four gradient colors (Bullish Strong, Bullish Weak, Bearish Strong, Bearish Weak) and the Signal Line color to match your chart theme or personal preferences. The color scheme helps with quick visual pattern recognition during live trading.
Conclusion
The Aura Trend Momentum indicator represents a refined approach to momentum analysis, combining proven technical analysis concepts—momentum calculation, exponential smoothing, and normalization—into a cohesive, noise-filtered system. Its double-smoothing methodology addresses the primary weakness of traditional momentum oscillators (excessive noise) while maintaining the responsiveness needed for timely trade entries. The four-color gradient system and smart signal filtering provide clear, actionable insights that help traders identify high-probability momentum reversals and trend continuation opportunities. Whether you're a day trader seeking precise entry points or a swing trader looking for trend confirmation, this indicator offers the clarity and reliability needed for confident decision-making in dynamic market conditions.
```
Script open-source
Dans l'esprit TradingView, le créateur de ce script l'a rendu open source afin que les traders puissent examiner et vérifier ses fonctionnalités. Bravo à l'auteur! Bien que vous puissiez l'utiliser gratuitement, n'oubliez pas que la republication du code est soumise à nos Règles.

🚀🚀🚀 Pineify - pineify.app
Essential Toolkit for Every Trader
- AI Pine Script Generator
- Finance AI Agent
- AI Stock Picker
- Pine Script Visual Editor
- Invited indicators
- Strategy Optimizer
- Trading Journal
- Backtest Report
Essential Toolkit for Every Trader
- AI Pine Script Generator
- Finance AI Agent
- AI Stock Picker
- Pine Script Visual Editor
- Invited indicators
- Strategy Optimizer
- Trading Journal
- Backtest Report
Clause de non-responsabilité
Les informations et publications ne sont pas destinées à être, et ne constituent pas, des conseils ou recommandations financiers, d'investissement, de trading ou autres fournis ou approuvés par TradingView. Pour en savoir plus, consultez les Conditions d'utilisation.
Script open-source
Dans l'esprit TradingView, le créateur de ce script l'a rendu open source afin que les traders puissent examiner et vérifier ses fonctionnalités. Bravo à l'auteur! Bien que vous puissiez l'utiliser gratuitement, n'oubliez pas que la republication du code est soumise à nos Règles.
🚀🚀🚀 Pineify - pineify.app
Essential Toolkit for Every Trader
- AI Pine Script Generator
- Finance AI Agent
- AI Stock Picker
- Pine Script Visual Editor
- Invited indicators
- Strategy Optimizer
- Trading Journal
- Backtest Report
Essential Toolkit for Every Trader
- AI Pine Script Generator
- Finance AI Agent
- AI Stock Picker
- Pine Script Visual Editor
- Invited indicators
- Strategy Optimizer
- Trading Journal
- Backtest Report
Clause de non-responsabilité
Les informations et publications ne sont pas destinées à être, et ne constituent pas, des conseils ou recommandations financiers, d'investissement, de trading ou autres fournis ou approuvés par TradingView. Pour en savoir plus, consultez les Conditions d'utilisation.