[HuD] Yearly High Low
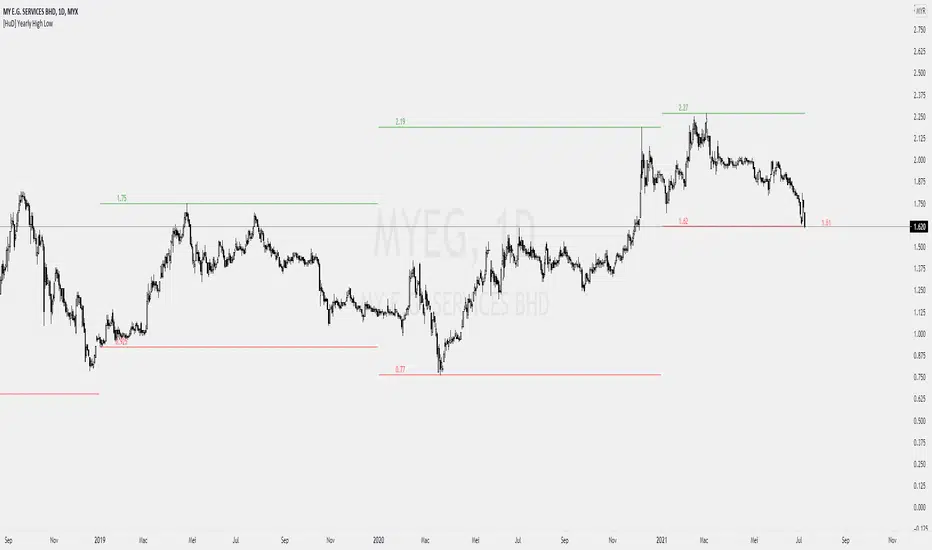
1. Indicator will display highest and lowest price level within yearly period.
- Highest Yearly Price = green line
- Lowest Yearly Price = red line
2. User also has an option to display Monthly high and low level.
- Monthly Highest Price = Blue Line
- Monthly Lowest Price = Orange Line
- Highest Yearly Price = green line
- Lowest Yearly Price = red line
2. User also has an option to display Monthly high and low level.
- Monthly Highest Price = Blue Line
- Monthly Lowest Price = Orange Line

Clause de non-responsabilité
Les informations et publications ne sont pas destinées à être, et ne constituent pas, des conseils ou recommandations financiers, d'investissement, de trading ou autres fournis ou approuvés par TradingView. Pour en savoir plus, consultez les Conditions d'utilisation.
Clause de non-responsabilité
Les informations et publications ne sont pas destinées à être, et ne constituent pas, des conseils ou recommandations financiers, d'investissement, de trading ou autres fournis ou approuvés par TradingView. Pour en savoir plus, consultez les Conditions d'utilisation.