Mr. Love Algo Trend
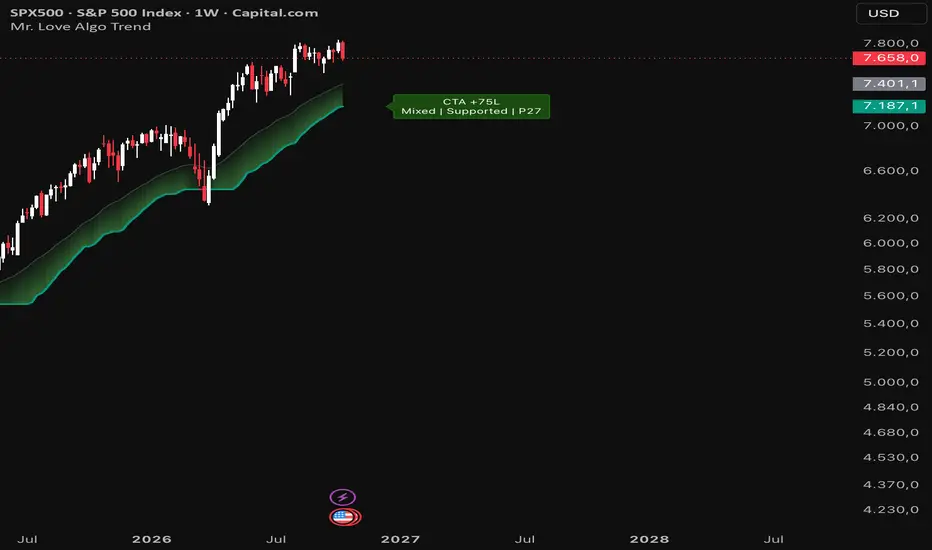
Mr. Love Algo Trend combines three things in one overlay: a volatility-adaptive trailing trend line (the "Trend Wave"), a multi-horizon daily trend model that estimates a CTA-style exposure, and an optional hypothetical simulation that shows how the wave signal would have behaved when executed at the next bar's open. All results are compressed into one status label next to the last bar, with a detailed tooltip on hover.
The goal is not to give buy/sell signals, but to answer three questions at a glance:
• Which way is the current trend wave pointing, and how much room does price have to it?
• Does the higher-level daily trend agree with it, and how strong is that trend?
• How would a disciplined, rule-based follower of the wave have fared historically?
WHAT YOU SEE ON THE CHART
• Trend Wave (thick line): teal in an up-wave, red in a down-wave.
• Wave Basis (thin grey line): the moving average the wave is built around.
• Band Fill: shaded area between basis and wave. In "Adaptive" mode it gets stronger the further price trades away from the wave.
• Status Label (right of the last bar), e.g.
CTA +75L
Mixed | Supported | P3
• Optional: five daily EMAs (Fast, Tactical, Core, Anchor, Macro) and a simulation panel.
HOW IT WORKS
1) Trend Wave
• Basis: EMA(34) of close (MA type and length adjustable in the Custom preset).
• Band: 1.3 × ATR(11) × (ATR(11) / ATR(42)) ^ 1.0
The ratio of short-term to reference volatility makes the band adaptive: it widens when volatility expands and tightens when markets calm down. The adaptation exponent can be set to 0 for a classic fixed ATR band.
• Ratchet: in an up-wave the line can only rise or stay flat (max of previous value and basis − band). In a down-wave it can only fall or stay flat (min of previous value and basis + band).
• Flip: the direction changes when a bar closes through the wave. The level is kept on the flip, which produces the characteristic flat "shelves" that often act as support/resistance.
• Presets: 42 (default), 21 (faster) and 84 (slower) scale all lengths together. "Custom" unlocks every parameter.
Wave structure (label and tooltip):
• Supported: price is on the trend side of the wave by more than the neutral zone (default 0.25 ATR).
• Testing: price is within the neutral zone around the wave.
• Breaking: price is on the wrong side intrabar (a flip happens only on the close).
Distance percentile (P0–P100): where today's ATR-normalised distance between price and wave ranks against the last 100 bars. Low values (e.g. P3) mean price is unusually close to the wave, i.e. a pullback into the trend line. High values mean price is extended.
Basis slope: the tooltip reports whether the 5-bar slope of the basis confirms or diverges from the wave direction.
2) Daily Trend Engine
Always calculated on daily bars, independent of the chart timeframe:
• Five EMAs: Fast 20, Tactical 50, Core 100, Anchor 200, Macro 250.
• Three horizons from EMA spreads, each normalised by ATR(14) × √length:
Fast = Fast vs Tactical, Medium = Tactical vs Core, Slow = Core vs Anchor and Anchor vs Macro.
• Each horizon is shown as Up, Down or Flat (inside the neutral zone).
• Trend Score (0–100): a direction-neutral strength score built from the weighted horizon composite. Direction is reported separately. ≥75 = strong, 60–75 = moderate, below 60 = weak.
• CTA exposure estimate: each horizon contributes ±25%. The remaining 25% is only added when price is also beyond the fast EMA in trend direction. A strong trend that is currently pulling back therefore shows ±75% instead of ±100%. This is a simplified, single-symbol illustration of how trend-following funds scale exposure. It is not a replication of any fund or of real positioning data.
Context state (first item in the label's second line):
• Strong: wave and daily trend agree and the trend score is strong.
• Mixed: they agree but the trend score is only moderate.
• Weak: they agree but the trend score is weak.
• Conflict: wave and daily trend point in opposite directions.
• Neutral: no clear daily trend.
• Unavailable: not enough daily history yet (or disabled on weekly/monthly charts).
3) Hypothetical Simulation
• Signal: wave direction at the bar close.
• Execution: next bar's open. Position modes: Long Only (long in up-waves, flat otherwise), Long/Short, or Short Only.
• Costs: a configurable round-trip cost (default 0.15%) is deducted on every position change.
• The optional panel shows equity, net return vs buy & hold, CAGR, max drawdown, number of closed trades, win rate, time in market and the target position for the next open.
• Start: a chosen date (default 2019-01-01) or the full available history.
HOW TO USE IT
• Trend filter: only consider trades in the direction of the wave, and prefer setups where the context state is Strong or Mixed rather than Conflict.
• Pullback location: a low distance percentile in a supported wave marks price close to its trend line. Flat wave shelves frequently act as reaction levels.
• Risk reference: the wave can serve as a volatility-adjusted trailing reference for stops or position reviews.
• Regime check: compare the wave direction on your trading timeframe with the daily trend engine before acting on lower-timeframe signals.
• Robustness check: use the simulation panel to see how the wave behaves on a given symbol and timeframe, including costs, before relying on it.
ALERTS
• Wave flip up
• Wave flip down
Create them via "Create Alert" → Condition: Mr. Love Algo Trend. Use "Once Per Bar Close" to avoid intrabar flips.
NOTES AND LIMITATIONS
• Wave flips are evaluated on the bar close. On the live, unfinished bar the colour, label and tooltip can change until the bar closes. Historical bars do not repaint.
• The daily trend engine uses request.security() on the daily timeframe without lookahead. On intraday charts the current day's values update in real time. On historical intraday bars, a day's final values only appear on that day's last bar; earlier bars show the previous day. On weekly/monthly charts the last daily value inside each bar is used (can be switched off).
• The trend score, horizons and CTA exposure need about 250 daily bars of history.
• The simulation is hypothetical: no slippage model, no taxes, no financing costs, full position size at each signal, and returns are compounded bar by bar. Past results do not predict future results.
• The CTA exposure is an illustrative model output, not real fund positioning.
DISCLAIMER
This script is for educational and informational purposes only and does not constitute financial advice or a recommendation to buy or sell any instrument. Trading involves risk. Always do your own research and use proper risk management.
The goal is not to give buy/sell signals, but to answer three questions at a glance:
• Which way is the current trend wave pointing, and how much room does price have to it?
• Does the higher-level daily trend agree with it, and how strong is that trend?
• How would a disciplined, rule-based follower of the wave have fared historically?
WHAT YOU SEE ON THE CHART
• Trend Wave (thick line): teal in an up-wave, red in a down-wave.
• Wave Basis (thin grey line): the moving average the wave is built around.
• Band Fill: shaded area between basis and wave. In "Adaptive" mode it gets stronger the further price trades away from the wave.
• Status Label (right of the last bar), e.g.
CTA +75L
Mixed | Supported | P3
• Optional: five daily EMAs (Fast, Tactical, Core, Anchor, Macro) and a simulation panel.
HOW IT WORKS
1) Trend Wave
• Basis: EMA(34) of close (MA type and length adjustable in the Custom preset).
• Band: 1.3 × ATR(11) × (ATR(11) / ATR(42)) ^ 1.0
The ratio of short-term to reference volatility makes the band adaptive: it widens when volatility expands and tightens when markets calm down. The adaptation exponent can be set to 0 for a classic fixed ATR band.
• Ratchet: in an up-wave the line can only rise or stay flat (max of previous value and basis − band). In a down-wave it can only fall or stay flat (min of previous value and basis + band).
• Flip: the direction changes when a bar closes through the wave. The level is kept on the flip, which produces the characteristic flat "shelves" that often act as support/resistance.
• Presets: 42 (default), 21 (faster) and 84 (slower) scale all lengths together. "Custom" unlocks every parameter.
Wave structure (label and tooltip):
• Supported: price is on the trend side of the wave by more than the neutral zone (default 0.25 ATR).
• Testing: price is within the neutral zone around the wave.
• Breaking: price is on the wrong side intrabar (a flip happens only on the close).
Distance percentile (P0–P100): where today's ATR-normalised distance between price and wave ranks against the last 100 bars. Low values (e.g. P3) mean price is unusually close to the wave, i.e. a pullback into the trend line. High values mean price is extended.
Basis slope: the tooltip reports whether the 5-bar slope of the basis confirms or diverges from the wave direction.
2) Daily Trend Engine
Always calculated on daily bars, independent of the chart timeframe:
• Five EMAs: Fast 20, Tactical 50, Core 100, Anchor 200, Macro 250.
• Three horizons from EMA spreads, each normalised by ATR(14) × √length:
Fast = Fast vs Tactical, Medium = Tactical vs Core, Slow = Core vs Anchor and Anchor vs Macro.
• Each horizon is shown as Up, Down or Flat (inside the neutral zone).
• Trend Score (0–100): a direction-neutral strength score built from the weighted horizon composite. Direction is reported separately. ≥75 = strong, 60–75 = moderate, below 60 = weak.
• CTA exposure estimate: each horizon contributes ±25%. The remaining 25% is only added when price is also beyond the fast EMA in trend direction. A strong trend that is currently pulling back therefore shows ±75% instead of ±100%. This is a simplified, single-symbol illustration of how trend-following funds scale exposure. It is not a replication of any fund or of real positioning data.
Context state (first item in the label's second line):
• Strong: wave and daily trend agree and the trend score is strong.
• Mixed: they agree but the trend score is only moderate.
• Weak: they agree but the trend score is weak.
• Conflict: wave and daily trend point in opposite directions.
• Neutral: no clear daily trend.
• Unavailable: not enough daily history yet (or disabled on weekly/monthly charts).
3) Hypothetical Simulation
• Signal: wave direction at the bar close.
• Execution: next bar's open. Position modes: Long Only (long in up-waves, flat otherwise), Long/Short, or Short Only.
• Costs: a configurable round-trip cost (default 0.15%) is deducted on every position change.
• The optional panel shows equity, net return vs buy & hold, CAGR, max drawdown, number of closed trades, win rate, time in market and the target position for the next open.
• Start: a chosen date (default 2019-01-01) or the full available history.
HOW TO USE IT
• Trend filter: only consider trades in the direction of the wave, and prefer setups where the context state is Strong or Mixed rather than Conflict.
• Pullback location: a low distance percentile in a supported wave marks price close to its trend line. Flat wave shelves frequently act as reaction levels.
• Risk reference: the wave can serve as a volatility-adjusted trailing reference for stops or position reviews.
• Regime check: compare the wave direction on your trading timeframe with the daily trend engine before acting on lower-timeframe signals.
• Robustness check: use the simulation panel to see how the wave behaves on a given symbol and timeframe, including costs, before relying on it.
ALERTS
• Wave flip up
• Wave flip down
Create them via "Create Alert" → Condition: Mr. Love Algo Trend. Use "Once Per Bar Close" to avoid intrabar flips.
NOTES AND LIMITATIONS
• Wave flips are evaluated on the bar close. On the live, unfinished bar the colour, label and tooltip can change until the bar closes. Historical bars do not repaint.
• The daily trend engine uses request.security() on the daily timeframe without lookahead. On intraday charts the current day's values update in real time. On historical intraday bars, a day's final values only appear on that day's last bar; earlier bars show the previous day. On weekly/monthly charts the last daily value inside each bar is used (can be switched off).
• The trend score, horizons and CTA exposure need about 250 daily bars of history.
• The simulation is hypothetical: no slippage model, no taxes, no financing costs, full position size at each signal, and returns are compounded bar by bar. Past results do not predict future results.
• The CTA exposure is an illustrative model output, not real fund positioning.
DISCLAIMER
This script is for educational and informational purposes only and does not constitute financial advice or a recommendation to buy or sell any instrument. Trading involves risk. Always do your own research and use proper risk management.

Clause de non-responsabilité
Les informations et publications ne sont pas destinées à être, et ne constituent pas, des conseils ou recommandations financiers, d'investissement, de trading ou autres fournis ou approuvés par TradingView. Pour en savoir plus, consultez les Conditions d'utilisation.
Clause de non-responsabilité
Les informations et publications ne sont pas destinées à être, et ne constituent pas, des conseils ou recommandations financiers, d'investissement, de trading ou autres fournis ou approuvés par TradingView. Pour en savoir plus, consultez les Conditions d'utilisation.