OPEN-SOURCE SCRIPT
Mis à jour Trend Confluence Filter
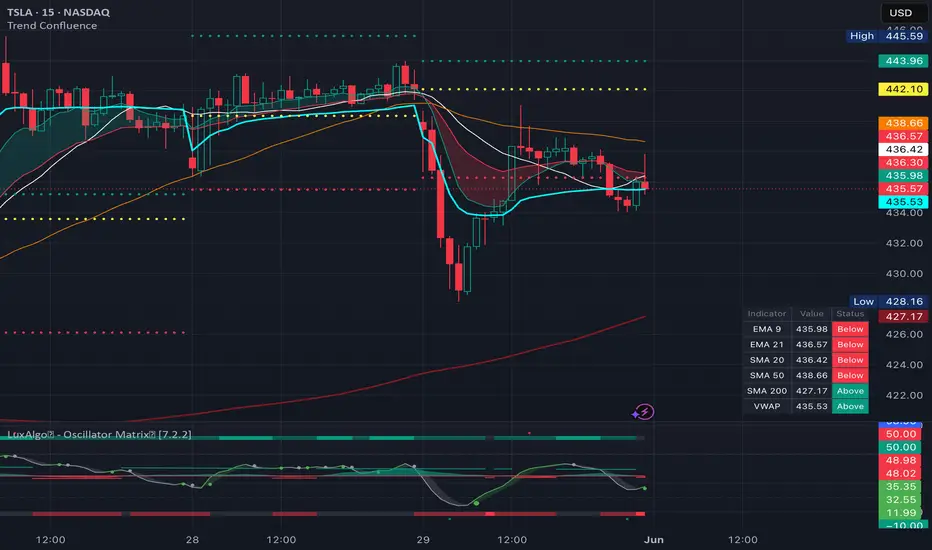
Trend Confluence Filter
This is scripted to combine multiple separate indicators — moving average alignment, VWAP, and yesterday's levels — that are often used together into a single overlay, each with adjustable inputs.
What's on the chart:
Session VWAP — Primary signal and institutional reference
EMA 9 / 21 ribbon — 9 and 21 EMA lines with a green/red dynamic ribbon that flips from green or red when EMA is 9/21 or 21/9
SMA 20 / 50 / 200 — Long-term structure at a glance
Yesterday's high, low, and close — Benchmark reference
Dashboard table — Color-coded based on current price vs. each MA and VWAP
Signals:
Bullish: SMAs stacked up 20/50/200, 1-5M (Intraday) or 15M (Swing) candle closing above the VWAP with a green ribbon, very bullish on an expanding ribbon (9 EMA trending up more strongly than the 21)
Bearish: Mirror the above
Trade in the direction of the SMA stack. Take the pullback signal when it holds near VWAP or a prior-day level — that confluence is part of the whole idea.
No advanced logic or PT's/SL's built in to keep it simpler and more generalized.
Script by // © TylerisTrading
This is scripted to combine multiple separate indicators — moving average alignment, VWAP, and yesterday's levels — that are often used together into a single overlay, each with adjustable inputs.
What's on the chart:
Session VWAP — Primary signal and institutional reference
EMA 9 / 21 ribbon — 9 and 21 EMA lines with a green/red dynamic ribbon that flips from green or red when EMA is 9/21 or 21/9
SMA 20 / 50 / 200 — Long-term structure at a glance
Yesterday's high, low, and close — Benchmark reference
Dashboard table — Color-coded based on current price vs. each MA and VWAP
Signals:
Bullish: SMAs stacked up 20/50/200, 1-5M (Intraday) or 15M (Swing) candle closing above the VWAP with a green ribbon, very bullish on an expanding ribbon (9 EMA trending up more strongly than the 21)
Bearish: Mirror the above
Trade in the direction of the SMA stack. Take the pullback signal when it holds near VWAP or a prior-day level — that confluence is part of the whole idea.
No advanced logic or PT's/SL's built in to keep it simpler and more generalized.
Script by // © TylerisTrading
Notes de version
Trend Confluence Filter combines multiple trend-following and market structure tools into a single clean overlay, helping traders quickly identify high-probability pullback opportunities at a quick glance by color-coding each level.The indicator plots a complete trend framework using the 20, 50, and 200 SMAs, 9 and 21 EMAs, session VWAP, and key previous-day levels (High, Low, and Close). A bullish trend is defined by a stacked SMA structure (20 > 50 > 200), while a bearish trend requires the inverse alignment.
An EMA ribbon between the 9 and 21 EMAs visually highlights short-term momentum, changing color based on trend direction. The indicator also monitors price interaction with the VWAP/SMA20 confluence area and generates pullback signals when price retraces into this zone and resumes in the direction of the prevailing trend.
Features include:
• 20, 50, and 200 SMA trend stack visualization
• 9/21 EMA crossover ribbon with dynamic bullish/bearish shading
• Session VWAP for intraday bias and mean value reference
• Previous Day High, Low, and Close levels
• Bullish and bearish pullback entry signals based on trend confluence
• Customizable colors and display settings
• Real-time dashboard showing price position relative to all key averages and VWAP
• Built-in alert function for EMA crossovers and price/VWAP crossovers
This indicator is designed for trend traders seeking objective confluence between moving averages, VWAP, and market structure to improve trade selection and directional bias.
Script open-source
Dans l'esprit TradingView, le créateur de ce script l'a rendu open source afin que les traders puissent examiner et vérifier ses fonctionnalités. Bravo à l'auteur! Bien que vous puissiez l'utiliser gratuitement, n'oubliez pas que la republication du code est soumise à nos Règles.

// © TylerisTrading
Clause de non-responsabilité
Les informations et publications ne sont pas destinées à être, et ne constituent pas, des conseils ou recommandations financiers, d'investissement, de trading ou autres fournis ou approuvés par TradingView. Pour en savoir plus, consultez les Conditions d'utilisation.
Script open-source
Dans l'esprit TradingView, le créateur de ce script l'a rendu open source afin que les traders puissent examiner et vérifier ses fonctionnalités. Bravo à l'auteur! Bien que vous puissiez l'utiliser gratuitement, n'oubliez pas que la republication du code est soumise à nos Règles.
// © TylerisTrading
Clause de non-responsabilité
Les informations et publications ne sont pas destinées à être, et ne constituent pas, des conseils ou recommandations financiers, d'investissement, de trading ou autres fournis ou approuvés par TradingView. Pour en savoir plus, consultez les Conditions d'utilisation.