Mis à jour
[blackcat] L2 Ehlers DC using the Phase Accumulation
Level: 2
Background
John F. Ehlers introuced Measuring the Dominant Cycle using the Phase Accumulation in his "Cycle Analytics for Traders" chapter 14 on 2013.
Function
With Hilbert transformer, the next algorithm to compute the dominant cycle is the phase accumulation method. The phase accumulation method of computing the dominant cycle is perhaps the easiest to comprehend. In this technique, we measure the phase at each sample by taking the arctangent of the ratio of the quadrature component to the in-phase component. A delta phase is generated by taking the difference of the phase between successive samples. At each sample we can then look backwards, adding up the delta phases. When the sum of the delta phases reaches 360 degrees, we must have passed through one full cycle, on average. The process is repeated for each new sample.
The phase accumulation method of cycle measurement always uses one full cycle's worth of historical data. This is both an advantage and a disadvantage. The advantage is the lag in obtaining the answer scales directly with the cycle period. That is, the measurement of a short cycle period has less lag than the measurement of a longer cycle period. However, the number of samples used in making the measurement means the averaging period is variable with cycle period. Longer averaging reduces the noise level compared to the signal. Therefore, shorter cycle periods necessarily have a higher output signal-to-noise ratio.
Key Signal
DomCycle --> Dominant Cycle
Pros and Cons
100% John F. Ehlers definition translation, even variable names are the same. This help readers who would like to use pine to read his book.
Remarks
The 60th script for Blackcat1402 John F. Ehlers Week publication.
Readme
In real life, I am a prolific inventor. I have successfully applied for more than 60 international and regional patents in the past 12 years. But in the past two years or so, I have tried to transfer my creativity to the development of trading strategies. Tradingview is the ideal platform for me. I am selecting and contributing some of the hundreds of scripts to publish in Tradingview community. Welcome everyone to interact with me to discuss these interesting pine scripts.
The scripts posted are categorized into 5 levels according to my efforts or manhours put into these works.
Level 1 : interesting script snippets or distinctive improvement from classic indicators or strategy. Level 1 scripts can usually appear in more complex indicators as a function module or element.
Level 2 : composite indicator/strategy. By selecting or combining several independent or dependent functions or sub indicators in proper way, the composite script exhibits a resonance phenomenon which can filter out noise or fake trading signal to enhance trading confidence level.
Level 3 : comprehensive indicator/strategy. They are simple trading systems based on my strategies. They are commonly containing several or all of entry signal, close signal, stop loss, take profit, re-entry, risk management, and position sizing techniques. Even some interesting fundamental and mass psychological aspects are incorporated.
Level 4 : script snippets or functions that do not disclose source code. Interesting element that can reveal market laws and work as raw material for indicators and strategies. If you find Level 1~2 scripts are helpful, Level 4 is a private version that took me far more efforts to develop.
Level 5 : indicator/strategy that do not disclose source code. private version of Level 3 script with my accumulated script processing skills or a large number of custom functions. I had a private function library built in past two years. Level 5 scripts use many of them to achieve private trading strategy.
Background
John F. Ehlers introuced Measuring the Dominant Cycle using the Phase Accumulation in his "Cycle Analytics for Traders" chapter 14 on 2013.
Function
With Hilbert transformer, the next algorithm to compute the dominant cycle is the phase accumulation method. The phase accumulation method of computing the dominant cycle is perhaps the easiest to comprehend. In this technique, we measure the phase at each sample by taking the arctangent of the ratio of the quadrature component to the in-phase component. A delta phase is generated by taking the difference of the phase between successive samples. At each sample we can then look backwards, adding up the delta phases. When the sum of the delta phases reaches 360 degrees, we must have passed through one full cycle, on average. The process is repeated for each new sample.
The phase accumulation method of cycle measurement always uses one full cycle's worth of historical data. This is both an advantage and a disadvantage. The advantage is the lag in obtaining the answer scales directly with the cycle period. That is, the measurement of a short cycle period has less lag than the measurement of a longer cycle period. However, the number of samples used in making the measurement means the averaging period is variable with cycle period. Longer averaging reduces the noise level compared to the signal. Therefore, shorter cycle periods necessarily have a higher output signal-to-noise ratio.
Key Signal
DomCycle --> Dominant Cycle
Pros and Cons
100% John F. Ehlers definition translation, even variable names are the same. This help readers who would like to use pine to read his book.
Remarks
The 60th script for Blackcat1402 John F. Ehlers Week publication.
Readme
In real life, I am a prolific inventor. I have successfully applied for more than 60 international and regional patents in the past 12 years. But in the past two years or so, I have tried to transfer my creativity to the development of trading strategies. Tradingview is the ideal platform for me. I am selecting and contributing some of the hundreds of scripts to publish in Tradingview community. Welcome everyone to interact with me to discuss these interesting pine scripts.
The scripts posted are categorized into 5 levels according to my efforts or manhours put into these works.
Level 1 : interesting script snippets or distinctive improvement from classic indicators or strategy. Level 1 scripts can usually appear in more complex indicators as a function module or element.
Level 2 : composite indicator/strategy. By selecting or combining several independent or dependent functions or sub indicators in proper way, the composite script exhibits a resonance phenomenon which can filter out noise or fake trading signal to enhance trading confidence level.
Level 3 : comprehensive indicator/strategy. They are simple trading systems based on my strategies. They are commonly containing several or all of entry signal, close signal, stop loss, take profit, re-entry, risk management, and position sizing techniques. Even some interesting fundamental and mass psychological aspects are incorporated.
Level 4 : script snippets or functions that do not disclose source code. Interesting element that can reveal market laws and work as raw material for indicators and strategies. If you find Level 1~2 scripts are helpful, Level 4 is a private version that took me far more efforts to develop.
Level 5 : indicator/strategy that do not disclose source code. private version of Level 3 script with my accumulated script processing skills or a large number of custom functions. I had a private function library built in past two years. Level 5 scripts use many of them to achieve private trading strategy.
Notes de version
OVERVIEWThe [blackcat] L2 Ehlers DC using the Phase Accumulation indicator calculates dominant cycle periods in price action using Ehlers' Phase Accumulation method, offering traders insights into market cycles through advanced signal processing techniques.
FEATURES
• Implements Ehlers' Phase Accumulation algorithm
• Features highpass filtering and Super Smoother filtering
• Calculates instantaneous periods using phase accumulation
• Provides dual visualization methods
• Adjustable LPPeriod parameter for customization
HOW TO USE
Add the indicator to your chart
Configure the LPPeriod input parameter: • Default value: 20 • Range: 1-100
Interpret the cycle periods displayed on the chart
LIMITATIONS
• Performance depends on market conditions
• Requires sufficient historical data
• Best suited for longer timeframes
NOTES
• Yellow columns display base cycle periods
• Fuchsia line tracks current cycle period
• Minimum phase difference is set to 10
• Maximum phase difference is limited to 48
• Phase accumulation window spans 40 bars
Notes de version
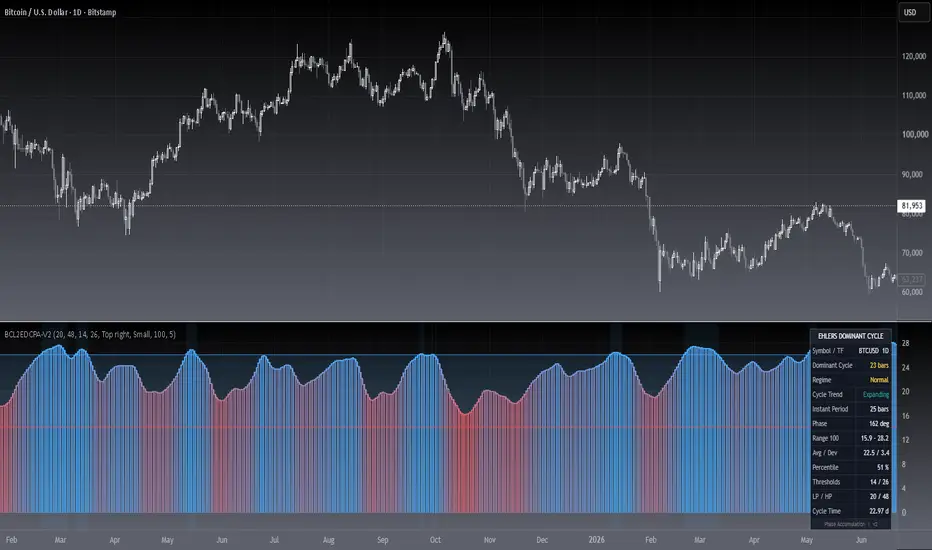
█ OVERVIEWThis indicator measures the dominant cycle of price with Ehlers' phase accumulation method and plots it as a colour-coded cycle-length histogram. It shows how fast the market is cycling right now, so you can match stops, targets and indicator lengths to the actual rhythm instead of a fixed guess.
█ CONCEPTS
Every market segment has a dominant cycle. Knowing its length tells you whether the current swing is short-lived noise or a slow, tradeable wave.
The script removes the trend from price, measures how fast the phase of the remaining cycle rotates, and converts that rotation into a number of bars. The result is the dominant cycle length.
Key principles:
• Phase rotation gives a far more stable estimate than peak-to-peak counting
• Long cycle (above 30 bars): smooth trend, wider stops, trend following works
• Short cycle (below 12 bars): choppy and noisy, breakout and mean-reversion methods degrade
• An expanding or contracting cycle warns that the swing structure is changing
█ HOW TO USE
1 — Add the indicator on a separate pane. The pane shows cycle length in bars, not price.
2 — Read the status table for the current value, regime and statistics.
3 — Compare the reading with your own setup: if you trade a 20-bar pullback while the cycle is 8 bars, your stops and targets are mismatched.
Input Parameters
• LP Period: SuperSmoother period for the filtered price and the measured period. Default 20.
• HP Period: high-pass cut-off that removes the trend. Default 48.
• Smooth Dominant Cycle: smooths the instantaneous period.
• Fast / Slow Cycle Threshold: the two regime borders. Defaults 14 and 26.
• Histogram, step line, raw period, zone fill, threshold lines, background tint and bar colour are all switchable.
• Status table: position, text size, statistics lookback, slope lookback.
█ VISUALS AND SIGNALS
Pane
• Columns and step line: dominant cycle length in bars
• Colour gradient: red for a fast cycle, blue for a slow cycle
• Grey line (optional): raw, unsmoothed instantaneous period
• Shaded zones and horizontal lines: the fast and slow thresholds
• Background tint and bar colour (optional): regime at a glance
Status table
• Dominant Cycle: current length in bars, tinted by regime
• Regime: Fast / Choppy, Normal or Slow / Trending
• Cycle Trend: Expanding, Contracting or Stable over the slope lookback
• Instant Period and Phase: the raw measurement behind the average
• Range, Avg / Dev and Percentile: where the current cycle sits inside the lookback window
• Thresholds, LP / HP and Cycle Time: settings plus the cycle expressed in real time on the current timeframe
Alerts
• Cycle entered slow regime / fast regime
• Cycle turned up / turned down
█ IMPLEMENTATION NOTES
Open source. The core is the Ehlers phase accumulation routine: a two-pole high-pass filter, a two-pole SuperSmoother, an in-phase and quadrature pair normalised by decaying peaks, a four-quadrant arctangent for the phase, then accumulation of the phase advance until 360 degrees is completed.
Version 2 fixes the wrap-around test of the original: the phase is converted to degrees before the 0..360 comparison, so the branch that corrects a jump from 350 to 10 degrees now fires as intended. Every division is guarded, the normalising peaks can no longer produce a zero-division, and the user's threshold inputs are auto-ordered so the regime bands stay valid.
█ LIMITATIONS
• The measurement is band limited: roughly 8 to 36 bars per revolution
• The last bar can still change until the candle closes
• Not a signal generator: no entry or exit markers are drawn
• Best on liquid instruments and timeframes of 15 minutes and above
• Gaps and very low volatility can distort the phase estimate
█ NOTES
• Research tool: use it to size stops, targets and indicator lengths
• Based on the cycle analysis work of John Ehlers
• Attribution appreciated when reused
═════════════════════════════════════════════════════════════════════════
For questions or feedback, use the comments section below.

Don't miss out! The first and most important thing to do is to join my Discord chat now! Click here to start your adventure: discord.com/invite/ZTGpQJq My new github for more pine development soon: github.com/wxt-coder
Clause de non-responsabilité
Les informations et publications ne sont pas destinées à être, et ne constituent pas, des conseils ou recommandations financiers, d'investissement, de trading ou autres fournis ou approuvés par TradingView. Pour en savoir plus, consultez les Conditions d'utilisation.
Don't miss out! The first and most important thing to do is to join my Discord chat now! Click here to start your adventure: discord.com/invite/ZTGpQJq My new github for more pine development soon: github.com/wxt-coder
Clause de non-responsabilité
Les informations et publications ne sont pas destinées à être, et ne constituent pas, des conseils ou recommandations financiers, d'investissement, de trading ou autres fournis ou approuvés par TradingView. Pour en savoir plus, consultez les Conditions d'utilisation.