OPEN-SOURCE SCRIPT
Mis à jour Liquidation Cascade Risk Map [AGPro Series]
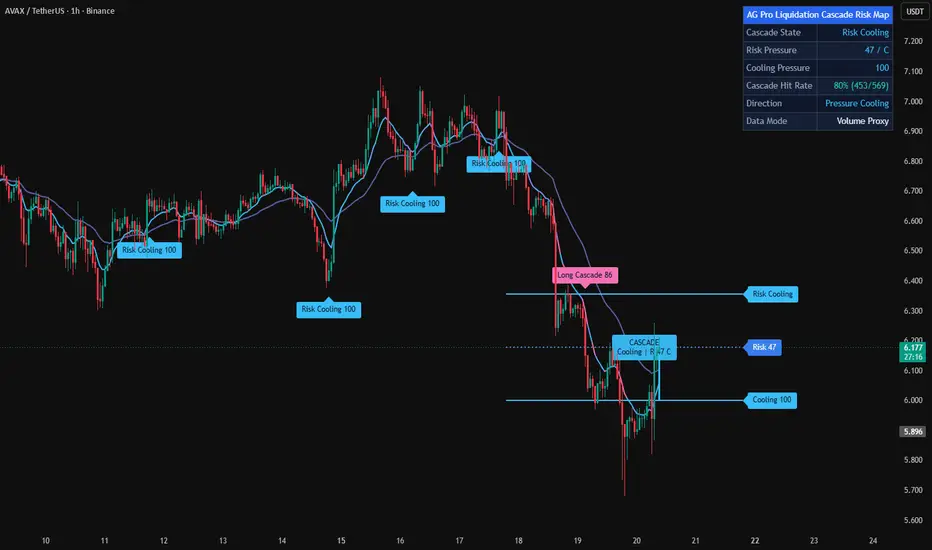
Liquidation Cascade Risk Map [AGPro Series]
🧠 Core Idea
When leverage pressure builds, is the market entering a real cascade-risk zone, or is liquidation pressure already cooling?
📌 Overview / What it does
Liquidation Cascade Risk Map [AGPro Series] is a crypto derivatives analysis tool designed to visualize liquidation-cascade risk without pretending to know exact exchange liquidation levels.
The script evaluates open interest data when available, falls back to a transparent volume-proxy mode when needed, and combines volatility expansion, range pressure, candle body stress, directional movement, and distance from reference structure into a single cascade-risk context.
It produces a cascade pressure path, right-side state tags, event labels, optional pulse markers, and a compact AG Pro dashboard panel. It does not predict future price, automate entries, provide liquidation prices, or act as a guaranteed signal system.
🎯 Purpose & Design Philosophy
This script was built for traders who want to understand when a crypto market may be carrying unstable leverage pressure.
Many liquidation tools focus on exact levels, heatmaps, or speculative liquidation clusters. Those can be useful, but they often require external datasets and may create false certainty when used as chart overlays.
Liquidation Cascade Risk Map takes a different approach. It asks whether current market behavior has the ingredients of cascade vulnerability: expanding pressure, directional stress, range instability, aggressive bodies, and persistence.
⚡ Why This Script Is Different
Most tools focus on liquidation levels, estimated heatmap bands, or simple volatility alerts.
This script does NOT claim to know where every liquidation sits, and it does not draw exchange-style liquidation heatmaps.
Instead, it maps the quality of the surrounding cascade-risk environment. It highlights when the market is showing pressure that may support long-side cascade risk, short-side cascade risk, two-way cascade vulnerability, or cooling after a pressure build-up.
⚙️ Methodology
1. Context Detection
The script checks whether usable open interest data exists. If not, it can fall back to a volume-proxy model so the visual framework remains usable across more symbols.
2. Pressure Mapping
It evaluates data change, volatility shock, candle range pressure, body expansion, distance from reference structure, and directional movement.
3. Cascade Evaluation
Those components are blended into a cascade-risk score. The script then classifies the environment as Long Cascade Risk, Short Cascade Risk, Two-Way Cascade, Risk Cooling, Neutral Risk, or Data Missing.
4. Visual Output
The chart displays a cascade pressure path, a dotted center reference, a vertical pressure needle, right-side tags, event labels, and a panel that summarizes the active state.
🗺️ How to Read the Chart
The upper pressure rail represents elevated liquidation-cascade risk.
The lower pressure rail represents cooling or pressure release context.
The dotted centerline acts as the current reference path.
The vertical needle shows how stretched the active cascade-risk score is inside the pressure path.
Event labels identify important changes such as Long Cascade, Short Cascade, Two-Way Cascade, or Risk Cooling.
The panel summarizes state, score, data change, velocity, persistence, cooling, direction, grade, data mode, ATR shock, data source, and trend.
🚦 Signals & States
• Long Cascade Risk → downside pressure is elevated and long-side liquidation vulnerability may be rising
• Short Cascade Risk → upside pressure is elevated and short-side liquidation vulnerability may be rising
• Two-Way Cascade → volatility and pressure are elevated on both sides, suggesting unstable conditions
• Risk Cooling → cascade pressure is decreasing after a build-up
• Neutral Risk → no strong cascade-risk condition is currently active
• Data Missing → the selected data source is not usable on the current symbol or mode
🔔 Alerts Logic
Alerts can be enabled for Long Cascade Risk, Short Cascade Risk, Two-Way Cascade, and Risk Cooling.
Each alert triggers when the selected state becomes active. Alerts are designed as attention markers, not trade instructions.
🧩 Confluence Logic
The context becomes stronger when data expansion, volatility shock, range pressure, directional bias, and persistence align at the same time.
For example, high volatility with strong directional movement and rising pressure persistence may indicate a more unstable cascade-risk environment than volatility alone.
📊 When to Use
• Crypto perpetual futures
• High-volatility market phases
• Sharp directional moves
• Post-breakout acceleration
• Failed recovery or forced unwind environments
• Situations where leverage pressure may matter more than ordinary trend context
⚠️ When NOT to Use
• Very low liquidity symbols
• Symbols with unreliable volume or open interest data
• Extremely noisy low-timeframe charts
• Markets with abnormal gaps or data breaks
• Any situation where the user expects exact exchange liquidation prices
🎛️ Key Inputs
• Data Mode → chooses between automatic open interest, manual open interest symbol, or volume proxy
• Lookback Length → controls the normalization window for pressure scoring
• Fast / Slow Pressure Length → controls short-term and baseline pressure reaction
• Cascade Threshold → defines how demanding the script is before marking cascade-risk conditions
• Cooling Threshold → controls when pressure is considered to be cooling
• Persistence Bars → measures whether pressure is sustained or only momentary
• Visual settings → control labels, pulse markers, path visibility, panel layout, and font sizes
🖥️ Interface & Visual Design
The interface is built to make the chart readable at first glance.
The cascade path is intentionally not a large boxed zone. It is a pressure-path structure designed to remain visually distinct from corridor, ladder, and basis-style scripts.
The panel uses a merged AG Pro header row, compact metrics, and a dark professional layout. Visual elements avoid white or pale primary treatments so the script remains readable on both dark and light TradingView chart backgrounds.
🧪 Practical Usage Workflow
1. Read the panel state first.
2. Check whether Data Mode shows real open interest or volume proxy.
3. Look at the cascade pressure path and current needle position.
4. Check event labels for recent pressure build-up or cooling.
5. Compare the state with broader trend, volatility, and market structure.
🔍 Interpretation Guidelines
Do not treat a cascade-risk state as a direct entry or exit signal.
Use it as a context layer. The script is most useful when combined with structure, liquidity, volatility, market regime, and risk management.
Rising cascade risk can mean the market is becoming unstable. Cooling can mean pressure is easing, but it does not guarantee reversal or continuation.
🚫 What This Script Is NOT
This script is not a prediction engine.
It is not financial advice.
It is not an automated trading system.
It does not calculate exact liquidation prices.
It does not guarantee that a liquidation cascade will happen.
⚠️ Limitations & Transparency
Open interest availability depends on symbol, exchange, and TradingView data support.
Volume proxy mode is only a proxy. It can help visualize pressure context, but it is not the same as real open interest.
Different timeframes may produce different readings.
Fast markets, illiquid symbols, gaps, and abnormal candles can affect outputs.
🧠 Market Context Notes
Liquidation pressure is often connected to leverage, volatility, liquidity, and forced positioning.
This script focuses on context quality rather than exact liquidation geography. That makes it useful as a decision-support layer, but it should always be interpreted with broader market evidence.
🧾 Use Case Examples
When price accelerates downward while pressure score and persistence rise, the chart may show Long Cascade Risk.
When price squeezes upward with high pressure and volatility expansion, the chart may show Short Cascade Risk.
When volatility and pressure expand without clean directional separation, the chart may show Two-Way Cascade.
When pressure falls after a build-up, the chart may show Risk Cooling.
🧱 System Philosophy
AGProLabs scripts are built as structured decision-support tools.
The goal is not to make the chart louder. The goal is to make hidden market context easier to read, compare, and question.
🔐 Non-Promise Statement
No script can remove uncertainty.
No state should be treated as certainty.
No visual element should replace trader judgment.
📉 Risk Disclosure
Trading involves risk.
Crypto derivatives and leveraged markets can be especially volatile.
This script is for educational and analytical purposes only.
Nothing in this script should be interpreted as financial advice, investment advice, or a guarantee of outcome.
Users remain fully responsible for their own decisions.
📚 Educational Note
Use this script to study how pressure, volatility, persistence, and directional stress interact before and after unstable crypto market moves.
🧠 Core Idea
When leverage pressure builds, is the market entering a real cascade-risk zone, or is liquidation pressure already cooling?
📌 Overview / What it does
Liquidation Cascade Risk Map [AGPro Series] is a crypto derivatives analysis tool designed to visualize liquidation-cascade risk without pretending to know exact exchange liquidation levels.
The script evaluates open interest data when available, falls back to a transparent volume-proxy mode when needed, and combines volatility expansion, range pressure, candle body stress, directional movement, and distance from reference structure into a single cascade-risk context.
It produces a cascade pressure path, right-side state tags, event labels, optional pulse markers, and a compact AG Pro dashboard panel. It does not predict future price, automate entries, provide liquidation prices, or act as a guaranteed signal system.
🎯 Purpose & Design Philosophy
This script was built for traders who want to understand when a crypto market may be carrying unstable leverage pressure.
Many liquidation tools focus on exact levels, heatmaps, or speculative liquidation clusters. Those can be useful, but they often require external datasets and may create false certainty when used as chart overlays.
Liquidation Cascade Risk Map takes a different approach. It asks whether current market behavior has the ingredients of cascade vulnerability: expanding pressure, directional stress, range instability, aggressive bodies, and persistence.
⚡ Why This Script Is Different
Most tools focus on liquidation levels, estimated heatmap bands, or simple volatility alerts.
This script does NOT claim to know where every liquidation sits, and it does not draw exchange-style liquidation heatmaps.
Instead, it maps the quality of the surrounding cascade-risk environment. It highlights when the market is showing pressure that may support long-side cascade risk, short-side cascade risk, two-way cascade vulnerability, or cooling after a pressure build-up.
⚙️ Methodology
1. Context Detection
The script checks whether usable open interest data exists. If not, it can fall back to a volume-proxy model so the visual framework remains usable across more symbols.
2. Pressure Mapping
It evaluates data change, volatility shock, candle range pressure, body expansion, distance from reference structure, and directional movement.
3. Cascade Evaluation
Those components are blended into a cascade-risk score. The script then classifies the environment as Long Cascade Risk, Short Cascade Risk, Two-Way Cascade, Risk Cooling, Neutral Risk, or Data Missing.
4. Visual Output
The chart displays a cascade pressure path, a dotted center reference, a vertical pressure needle, right-side tags, event labels, and a panel that summarizes the active state.
🗺️ How to Read the Chart
The upper pressure rail represents elevated liquidation-cascade risk.
The lower pressure rail represents cooling or pressure release context.
The dotted centerline acts as the current reference path.
The vertical needle shows how stretched the active cascade-risk score is inside the pressure path.
Event labels identify important changes such as Long Cascade, Short Cascade, Two-Way Cascade, or Risk Cooling.
The panel summarizes state, score, data change, velocity, persistence, cooling, direction, grade, data mode, ATR shock, data source, and trend.
🚦 Signals & States
• Long Cascade Risk → downside pressure is elevated and long-side liquidation vulnerability may be rising
• Short Cascade Risk → upside pressure is elevated and short-side liquidation vulnerability may be rising
• Two-Way Cascade → volatility and pressure are elevated on both sides, suggesting unstable conditions
• Risk Cooling → cascade pressure is decreasing after a build-up
• Neutral Risk → no strong cascade-risk condition is currently active
• Data Missing → the selected data source is not usable on the current symbol or mode
🔔 Alerts Logic
Alerts can be enabled for Long Cascade Risk, Short Cascade Risk, Two-Way Cascade, and Risk Cooling.
Each alert triggers when the selected state becomes active. Alerts are designed as attention markers, not trade instructions.
🧩 Confluence Logic
The context becomes stronger when data expansion, volatility shock, range pressure, directional bias, and persistence align at the same time.
For example, high volatility with strong directional movement and rising pressure persistence may indicate a more unstable cascade-risk environment than volatility alone.
📊 When to Use
• Crypto perpetual futures
• High-volatility market phases
• Sharp directional moves
• Post-breakout acceleration
• Failed recovery or forced unwind environments
• Situations where leverage pressure may matter more than ordinary trend context
⚠️ When NOT to Use
• Very low liquidity symbols
• Symbols with unreliable volume or open interest data
• Extremely noisy low-timeframe charts
• Markets with abnormal gaps or data breaks
• Any situation where the user expects exact exchange liquidation prices
🎛️ Key Inputs
• Data Mode → chooses between automatic open interest, manual open interest symbol, or volume proxy
• Lookback Length → controls the normalization window for pressure scoring
• Fast / Slow Pressure Length → controls short-term and baseline pressure reaction
• Cascade Threshold → defines how demanding the script is before marking cascade-risk conditions
• Cooling Threshold → controls when pressure is considered to be cooling
• Persistence Bars → measures whether pressure is sustained or only momentary
• Visual settings → control labels, pulse markers, path visibility, panel layout, and font sizes
🖥️ Interface & Visual Design
The interface is built to make the chart readable at first glance.
The cascade path is intentionally not a large boxed zone. It is a pressure-path structure designed to remain visually distinct from corridor, ladder, and basis-style scripts.
The panel uses a merged AG Pro header row, compact metrics, and a dark professional layout. Visual elements avoid white or pale primary treatments so the script remains readable on both dark and light TradingView chart backgrounds.
🧪 Practical Usage Workflow
1. Read the panel state first.
2. Check whether Data Mode shows real open interest or volume proxy.
3. Look at the cascade pressure path and current needle position.
4. Check event labels for recent pressure build-up or cooling.
5. Compare the state with broader trend, volatility, and market structure.
🔍 Interpretation Guidelines
Do not treat a cascade-risk state as a direct entry or exit signal.
Use it as a context layer. The script is most useful when combined with structure, liquidity, volatility, market regime, and risk management.
Rising cascade risk can mean the market is becoming unstable. Cooling can mean pressure is easing, but it does not guarantee reversal or continuation.
🚫 What This Script Is NOT
This script is not a prediction engine.
It is not financial advice.
It is not an automated trading system.
It does not calculate exact liquidation prices.
It does not guarantee that a liquidation cascade will happen.
⚠️ Limitations & Transparency
Open interest availability depends on symbol, exchange, and TradingView data support.
Volume proxy mode is only a proxy. It can help visualize pressure context, but it is not the same as real open interest.
Different timeframes may produce different readings.
Fast markets, illiquid symbols, gaps, and abnormal candles can affect outputs.
🧠 Market Context Notes
Liquidation pressure is often connected to leverage, volatility, liquidity, and forced positioning.
This script focuses on context quality rather than exact liquidation geography. That makes it useful as a decision-support layer, but it should always be interpreted with broader market evidence.
🧾 Use Case Examples
When price accelerates downward while pressure score and persistence rise, the chart may show Long Cascade Risk.
When price squeezes upward with high pressure and volatility expansion, the chart may show Short Cascade Risk.
When volatility and pressure expand without clean directional separation, the chart may show Two-Way Cascade.
When pressure falls after a build-up, the chart may show Risk Cooling.
🧱 System Philosophy
AGProLabs scripts are built as structured decision-support tools.
The goal is not to make the chart louder. The goal is to make hidden market context easier to read, compare, and question.
🔐 Non-Promise Statement
No script can remove uncertainty.
No state should be treated as certainty.
No visual element should replace trader judgment.
📉 Risk Disclosure
Trading involves risk.
Crypto derivatives and leveraged markets can be especially volatile.
This script is for educational and analytical purposes only.
Nothing in this script should be interpreted as financial advice, investment advice, or a guarantee of outcome.
Users remain fully responsible for their own decisions.
📚 Educational Note
Use this script to study how pressure, volatility, persistence, and directional stress interact before and after unstable crypto market moves.
Notes de version
🔧 UPDATE NOTES - 1.1This update focuses on chart readability, dashboard clarity, and visual hierarchy.
The core purpose of the script remains unchanged.
This release improves how the existing liquidation-cascade risk logic is presented, organized, and interpreted on the chart.
This script continues to function as an analytical and visualization tool.
It does not attempt to predict price direction or provide guaranteed outcomes.
------------------------
What Changed
------------------------
• Reworked the cascade staircase into a cleaner cascade board.
The visual risk area is now easier to read at first glance, with clearer risk, pressure, and cooling rails.
• Streamlined the panel layout.
The dashboard now uses a cleaner two-column structure focused on the most important state information.
• Added adaptive higher-timeframe projection.
Forward board rendering can shorten on higher timeframes so the visual object does not dominate the chart.
• Added Board Badge Anchor control.
Users can fine-tune where the centered cascade badge appears inside the board.
• Expanded panel controls.
The panel now supports more locations, Elite Dark, Slate, Clean Light themes, Huge font sizing, and live position updates.
------------------------
Visual Improvements
------------------------
• Reduced right-side tag and center-label overlap
• Improved cascade board readability on higher timeframes
• Refined state badges for cleaner first-glance interpretation
• Reduced dashboard density while keeping the key information visible
• Preserved the fast and slow pressure tracks for contextual reading
------------------------
Interface & Usability
------------------------
• Optimized panel layout for clearer information flow
• Added Middle Center panel placement support
• Added Slate panel theme while preserving dark and light options
• Added Huge font-size support while keeping Normal as the default
• Preserved the single merged blue AG Pro panel header row
------------------------
Behavior Notes
------------------------
This update does not change the core analytical logic of the script.
The open-interest / volume-proxy data flow, volatility shock model, participation-pressure scoring, displacement checks, wick-failure checks, cascade states, event labels, and alerts remain aligned with the original release.
The goal is to improve clarity and usability, not to introduce new predictive behavior.
------------------------
Limitations Reminder
------------------------
The script remains a rule-based analytical tool.
Open interest availability can vary by symbol and exchange. When open interest is unavailable, volume may be used only as a transparent participation-pressure proxy.
Outputs should always be interpreted within broader market context.
------------------------
Risk Reminder
------------------------
This script is for educational and analytical purposes only.
It does not provide financial advice or guaranteed trading outcomes.
Users remain responsible for their own decisions.
Notes de version
🔧 UPDATE NOTES - v1.2This update focuses on reliability transparency and chart readability.
The core purpose of the script remains unchanged. This release adds a self-measured reliability readout and improves how the existing cascade-risk logic is presented. It continues to function as an analytical and visualization tool. It does not display exchange liquidation levels, predict price direction, or provide guaranteed outcomes.
------------------------
What Changed
------------------------
• Added a Cascade Hit Rate readout.
When the script flags an elevated cascade-risk state (Long, Short, or Two-Way), it waits a configurable proof window and checks whether a significant move actually followed, then reports an honest, self-measured realization rate in the panel.
• Event labels now carry their score.
Each label shows the risk or cooling score (e.g. "Long Cascade 64", "Risk Cooling 100"), so every marker is informative instead of repetitive.
• Standardized label contrast.
All badges, tags, and event labels now compute readable text color automatically from their background, for consistent legibility across themes.
• Two-Way cascade labels were lifted off the candle body.
They no longer overlap price and now align with the other event markers.
• Hardened the volatility baseline.
An early-bar guard delivers cleaner behavior on the first bars of a chart.
------------------------
Visual Improvements
------------------------
• Improved chart readability by adding scores to event labels and removing repetition.
• Refined label contrast and positioning so key elements stay clear on any theme.
• Adjusted Two-Way label placement to avoid overlap with candles.
• Preserved a clean, capped event-label count for a premium chart.
------------------------
Interface & Usability
------------------------
• Added a Cascade Hit Rate row to the dashboard for at-a-glance reliability context.
• Improved label readability across the board badge, right-side tags, and events.
• Standardized font sizing to the chart label size setting.
• Enhanced overall user experience without changing the core risk logic.
------------------------
Behavior Notes
------------------------
This update does not change the core analytical logic of the script.
The goal is to improve clarity and reliability transparency, not to introduce new predictive behavior.
Users should interpret outputs the same way as before, now with an added reliability reference and clearer, score-tagged labels.
------------------------
Limitations Reminder
------------------------
The script remains a rule-based analytical tool.
When official open interest is unavailable, it transparently uses a volume proxy.
Market conditions such as volatility, liquidity, and timeframe differences may affect how signals and the hit rate appear. Outputs should always be interpreted within broader market context.
------------------------
Risk Reminder
------------------------
This script is for educational and analytical purposes only.
It does not provide financial advice or guaranteed trading outcomes.
Users remain responsible for their own decisions.
Script open-source
Dans l'esprit TradingView, le créateur de ce script l'a rendu open source afin que les traders puissent examiner et vérifier ses fonctionnalités. Bravo à l'auteur! Bien que vous puissiez l'utiliser gratuitement, n'oubliez pas que la republication du code est soumise à nos Règles.

Public-free scripts + invite-only AGPro workflows for market analysis, liquidity context, risk planning and execution review.
Rules-based. No hype. No guesswork.
Library & access: agprolabs.com/
Telegram: t.me/agprolabs
Rules-based. No hype. No guesswork.
Library & access: agprolabs.com/
Telegram: t.me/agprolabs
Clause de non-responsabilité
Les informations et publications ne sont pas destinées à être, et ne constituent pas, des conseils ou recommandations financiers, d'investissement, de trading ou autres fournis ou approuvés par TradingView. Pour en savoir plus, consultez les Conditions d'utilisation.
Script open-source
Dans l'esprit TradingView, le créateur de ce script l'a rendu open source afin que les traders puissent examiner et vérifier ses fonctionnalités. Bravo à l'auteur! Bien que vous puissiez l'utiliser gratuitement, n'oubliez pas que la republication du code est soumise à nos Règles.
Public-free scripts + invite-only AGPro workflows for market analysis, liquidity context, risk planning and execution review.
Rules-based. No hype. No guesswork.
Library & access: agprolabs.com/
Telegram: t.me/agprolabs
Rules-based. No hype. No guesswork.
Library & access: agprolabs.com/
Telegram: t.me/agprolabs
Clause de non-responsabilité
Les informations et publications ne sont pas destinées à être, et ne constituent pas, des conseils ou recommandations financiers, d'investissement, de trading ou autres fournis ou approuvés par TradingView. Pour en savoir plus, consultez les Conditions d'utilisation.