OPEN-SOURCE SCRIPT
Astrology Toolkit [SS]

🌌 Astrology Toolkit [SS]
Overview
The Astrology Toolkit [SS] is a multi-dimensional quantitative analysis tool designed to bridge the gap between celestial cycles and market price action. Unlike traditional "soft" astrology, this indicator treats zodiac transitions, lunar phases, and planetary retrogrades as granular seasonal features.
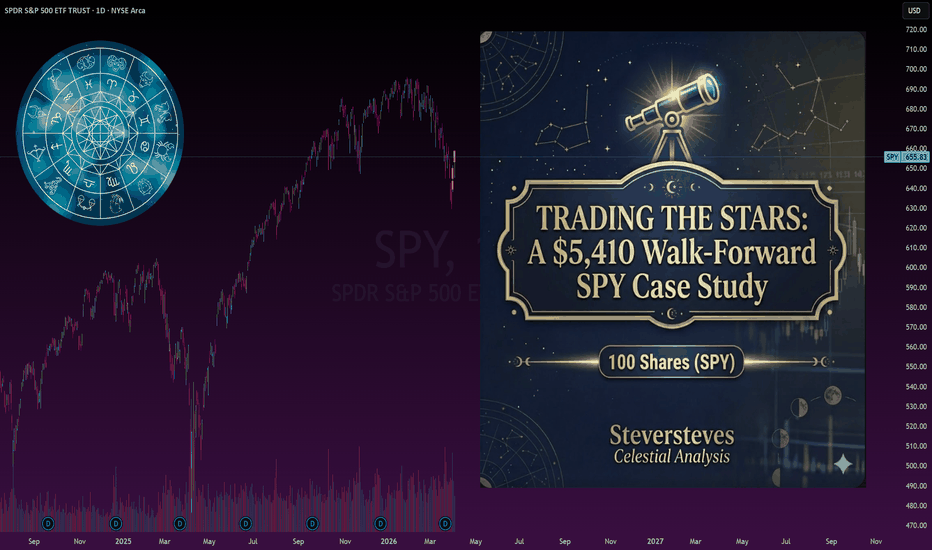
As documented in my article Trading the Stars: A $5,410 Walk-Forward SPY Case Study, machine learning models (Random Forest and Linear Regression) have identified these celestial markers as high impact features, often outperforming standard technical indicators like VWAP or Volatility in predictive power.
🛠 Key Features
Dynamic Zodiac Mapping
The indicator segments the chart into colored Zodiac Boxes. Each box represents a specific sign's season.
The Logic: Markets often exhibit distinct moods or risk appetites during different solar transits.
Visuals: The background color shifts automatically as the Sun enters a new constellation, providing a visual "heartbeat" of the astrological year.
Mercury Retrograde (The Pivot Filter)
Plotted as red background bands, these represent periods where Mercury appears to move backward in the sky.
Strategy Insight: Based on backtesting, Retrograde periods often act as major pivot zones. Trends that exist before the band often exhaust or reverse shortly after the period concludes.
Lunar Cycle Triggers
The indicator plots unique icons for the two primary lunar phases:
🌕 Full Moon: Associated with high-tide liquidity and potential local tops/exhaustion.
🌑 New Moon: Associated with dark periods of accumulation or local bottoms.
Smart Filter: The script uses a strict 25-bar cooldown to ensure you only see the actual start of the lunar event, preventing signal noise.
Real-Time Performance Table
A live updating table tracks the Average Seasonal Return % for each sign based on the last 1,000 days of data (this 1,000 lookback is customizable).
How to use:
Look for signs with high historical win rates (e.g., Cancer or Scorpio for SPX) to identify high-probability long and short windows.
⚙️ Inputs & Customization
From the settings menu, here are your customizable inputs and what they mean:
📈 How to Execute the Celestial-Stoch Strategy
Based on my own research and forward testing, the most robust way to trade this indicator is by using it as a Directional Bias filtered by Momentum.
The Setup
The Long Entry:
The Short Entry:
Risk Management:
Backtesting on SPX suggests a 1% to 2% Hard Stop Loss is optimal. The goal is to capture the Granular Seasonality of the 30-day zodiac window while protecting against black-swan volatility. However, it is important you tailor your risk management to your own comfortable level and to the equity you are trading, as each equity has its own unique ATR and volatility.
📅 Upcoming Events Tracker
Located in the bottom right, there is a secondary stable. This module keeps you ahead of the curve by projecting the exact dates for:
Conclusion
I built this indicator after testing the celestial / astrology strategy out of skepticism and intrigue. Because the backrest results were actually pretty solid for this, I decided to provide an indicator so anyone can apply the strategy!
If you are interested, I recommend reading my breakdown and analysis on this strategy in the article below:
Otherwise, thanks for reading/checking it out and as always, Safe Trades! 🚀🚀
Overview
The Astrology Toolkit [SS] is a multi-dimensional quantitative analysis tool designed to bridge the gap between celestial cycles and market price action. Unlike traditional "soft" astrology, this indicator treats zodiac transitions, lunar phases, and planetary retrogrades as granular seasonal features.
As documented in my article Trading the Stars: A $5,410 Walk-Forward SPY Case Study, machine learning models (Random Forest and Linear Regression) have identified these celestial markers as high impact features, often outperforming standard technical indicators like VWAP or Volatility in predictive power.
🛠 Key Features
Dynamic Zodiac Mapping
The indicator segments the chart into colored Zodiac Boxes. Each box represents a specific sign's season.
The Logic: Markets often exhibit distinct moods or risk appetites during different solar transits.
Visuals: The background color shifts automatically as the Sun enters a new constellation, providing a visual "heartbeat" of the astrological year.
Mercury Retrograde (The Pivot Filter)
Plotted as red background bands, these represent periods where Mercury appears to move backward in the sky.
Strategy Insight: Based on backtesting, Retrograde periods often act as major pivot zones. Trends that exist before the band often exhaust or reverse shortly after the period concludes.
Lunar Cycle Triggers
The indicator plots unique icons for the two primary lunar phases:
🌕 Full Moon: Associated with high-tide liquidity and potential local tops/exhaustion.
🌑 New Moon: Associated with dark periods of accumulation or local bottoms.
Smart Filter: The script uses a strict 25-bar cooldown to ensure you only see the actual start of the lunar event, preventing signal noise.
Real-Time Performance Table
A live updating table tracks the Average Seasonal Return % for each sign based on the last 1,000 days of data (this 1,000 lookback is customizable).
How to use:
Look for signs with high historical win rates (e.g., Cancer or Scorpio for SPX) to identify high-probability long and short windows.
⚙️ Inputs & Customization
From the settings menu, here are your customizable inputs and what they mean:
- Show Stats Table: Toggles the historical performance data on/off.
- Table Position: Move the stats to any corner of your screen to avoid overlapping your price action.
- Box Transparency: Adjust how "loud" the zodiac colors are (0 = solid, 100 = invisible).
- Show Retrograde: Toggles the red Mercury Retrograde bands.
- Stats Lookback: Defines how many days of history the indicator uses to calculate the average returns.
📈 How to Execute the Celestial-Stoch Strategy
Based on my own research and forward testing, the most robust way to trade this indicator is by using it as a Directional Bias filtered by Momentum.
The Setup
The Long Entry:
- Identify the Season: Check if the current Zodiac box is historically Bullish (e.g., Cancer) or Bearish (e.g., Taurus) based on the Stats Table.
- Apply the Filter: Use a standard Stochastic Oscillator (20/80 settings).
- Current Zodiac is Bullish and Stochastic %K is ≤20 (Oversold).
- Action: Enter Long and hold until the end of the Zodiac period.
The Short Entry:
- Current Zodiac is Bearish.
- Stochastic %K is ≥80 (Overbought).
- Action: Enter Short and hold until the end of the Zodiac period.
Risk Management:
Backtesting on SPX suggests a 1% to 2% Hard Stop Loss is optimal. The goal is to capture the Granular Seasonality of the 30-day zodiac window while protecting against black-swan volatility. However, it is important you tailor your risk management to your own comfortable level and to the equity you are trading, as each equity has its own unique ATR and volatility.
📅 Upcoming Events Tracker
Located in the bottom right, there is a secondary stable. This module keeps you ahead of the curve by projecting the exact dates for:
- The next Zodiac transition.
- The next Full Moon.
- The next New Moon.
Conclusion
I built this indicator after testing the celestial / astrology strategy out of skepticism and intrigue. Because the backrest results were actually pretty solid for this, I decided to provide an indicator so anyone can apply the strategy!
If you are interested, I recommend reading my breakdown and analysis on this strategy in the article below:
Otherwise, thanks for reading/checking it out and as always, Safe Trades! 🚀🚀
Script open-source
Dans l'esprit TradingView, le créateur de ce script l'a rendu open source afin que les traders puissent examiner et vérifier ses fonctionnalités. Bravo à l'auteur! Bien que vous puissiez l'utiliser gratuitement, n'oubliez pas que la republication du code est soumise à nos Règles.

Check out the new Website!
merlintrades.net
Get access to:
- Indicators
- Merlin Trading Software
- Discord
- Documentation
merlintrades.net
Get access to:
- Indicators
- Merlin Trading Software
- Discord
- Documentation
Clause de non-responsabilité
Les informations et publications ne sont pas destinées à être, et ne constituent pas, des conseils ou recommandations financiers, d'investissement, de trading ou autres fournis ou approuvés par TradingView. Pour en savoir plus, consultez les Conditions d'utilisation.
Script open-source
Dans l'esprit TradingView, le créateur de ce script l'a rendu open source afin que les traders puissent examiner et vérifier ses fonctionnalités. Bravo à l'auteur! Bien que vous puissiez l'utiliser gratuitement, n'oubliez pas que la republication du code est soumise à nos Règles.
Check out the new Website!
merlintrades.net
Get access to:
- Indicators
- Merlin Trading Software
- Discord
- Documentation
merlintrades.net
Get access to:
- Indicators
- Merlin Trading Software
- Discord
- Documentation
Clause de non-responsabilité
Les informations et publications ne sont pas destinées à être, et ne constituent pas, des conseils ou recommandations financiers, d'investissement, de trading ou autres fournis ou approuvés par TradingView. Pour en savoir plus, consultez les Conditions d'utilisation.