OPEN-SOURCE SCRIPT
Twiggs Liquidity & Order Block Engine [MarkitTick]
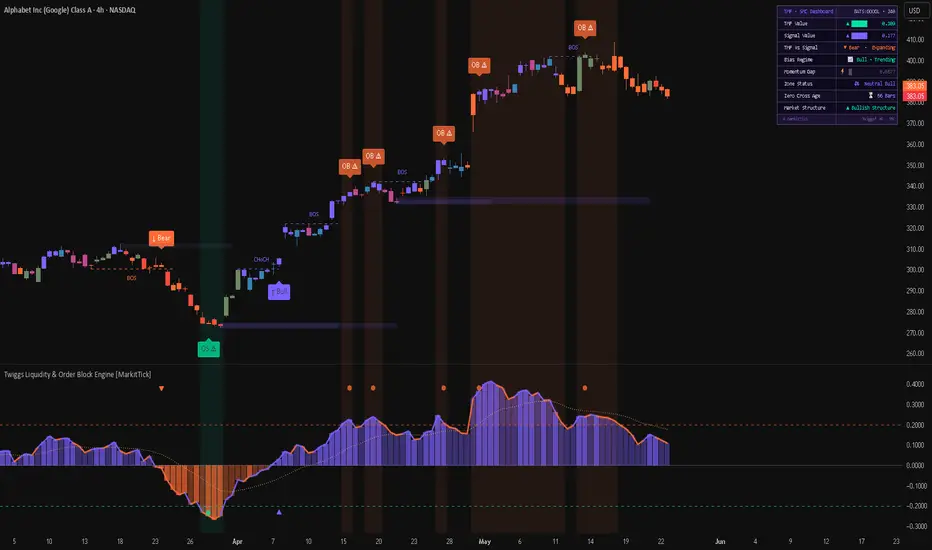
💡 Hybrid technical indicator designed to synthesize volume-weighted momentum with structural price action analysis. By harmonizing a modernized Twiggs Money Flow (TMF) algorithm with an automated Smart Money Concepts (SMC) overlay, this script provides a multi-dimensional perspective on market dynamics. Traders can monitor underlying accumulation and distribution cycles while simultaneously visualizing critical market structure shifts and historically significant supply and demand zones, offering a comprehensive, all-in-one chart analysis environment.
✨ Originality and Utility
● A Unique Analytical Mashup
Most technical analysis tools isolate either volume momentum or price action structure. This script introduces a vital mashup by blending the quantitative rigor of the Twiggs Money Flow with the visual geometry of Smart Money Concepts (SMC).
🔬 Methodology and Concepts
● The Twiggs Money Flow (TMF) Engine
The oscillator component of this script is rooted in the Twiggs Money Flow, which serves as an evolution of traditional money flow calculations.
● Smart Money Concepts (SMC) Architecture
The structural overlay maps the fractal nature of market trends using strict geometric logic.
🎨 Visual Guide
● Oscillator Pane Elements
● Price Chart Overlay
● Real-Time Dashboard
📖 How to Use
● Analyzing Momentum Crossovers
● Exploiting the Mashup Confluence
⚙️ Inputs and Settings
● Calculation Parameters
● Neon Colors
● SMC & Market Structure
🔍 Deconstruction of the Underlying Scientific and Academic Framework
● Volumetric Price Analysis Theory
The framework of this indicator is deeply anchored in auction market theory and the foundational work of Marc Chaikin, subsequently refined by Colin Twiggs. Traditional money flow indices often fail to capture the reality of market gaps, leading to incomplete volumetric profiles. By integrating the True Range calculation, the mathematics ensure that the proportional distance between the close and the absolute extreme of the session accurately reflects the terminal buying or selling pressure.
● Exponential Smoothing Mechanics
The internal architecture relies on parallel exponential moving averages (EMA). Unlike simple averages, the EMA assigns mathematically weighted significance to the most recent data points via an alpha constant (1/N). By smoothing the price-volume product and the raw volume independently before division, the indicator mitigates the erratic noise inherent in isolated volume spikes, producing a normalized quotient that tracks the authentic underlying liquidity flow.
● Fractal Market Structure & Geometric Support
The secondary framework relies on the premise that financial markets move in fractals, creating self-similar structures across all timeframes. By programmatically defining a "Swing" as a local extremum untouched over a specified sample size, the script mathematically formalizes the identification of supply and demand origin points. The dynamic projection of Order Blocks utilizes the Average True Range (ATR) as a standard deviation metric, recognizing that liquidity zones are not precise, one-dimensional price points, but rather two-dimensional areas defined by the asset's current historical volatility.
⚠️ Disclaimer
All provided scripts and indicators are strictly for educational exploration and must not be interpreted as financial advice or a recommendation to execute trades. I expressly disclaim all liability for any financial losses or damages that may result, directly or indirectly, from the reliance on or application of these tools. Market participation carries inherent risk where past performance never guarantees future returns, leaving all investment decisions and due diligence solely at your own discretion.
✨ Originality and Utility
● A Unique Analytical Mashup
Most technical analysis tools isolate either volume momentum or price action structure. This script introduces a vital mashup by blending the quantitative rigor of the Twiggs Money Flow with the visual geometry of Smart Money Concepts (SMC).
- The utility lies in cross-verification: an Order Block (structural support/resistance) becomes exponentially more actionable when validated by a corresponding surge or exhaustion in the TMF volume oscillator.
- This synthesis actively filters out false breakouts. A break of structure occurring on weak or divergent money flow can be flagged as a potential liquidity sweep rather than a genuine trend continuation.
- Additionally, the integration of a dynamic, real-time dashboard centralizes complex data, removing the need to manually cross-reference multiple traditional indicators, thereby saving screen space and enhancing cognitive focus during active chart analysis.
🔬 Methodology and Concepts
● The Twiggs Money Flow (TMF) Engine
The oscillator component of this script is rooted in the Twiggs Money Flow, which serves as an evolution of traditional money flow calculations.
- True Range Implementation: Rather than relying strictly on the high and low of the current candle, the engine calculates the True High (maximum of current high or previous close) and True Low (minimum of current low or previous close). This inherently factors in market gaps, preventing skewed volume data during highly volatile opens.
- Volume Multiplier: A proprietary multiplier determines the placement of the close relative to the True Range. The multiplier forces a value between -1.0 and +1.0, dictating the proportion of trading volume classified as buying pressure (accumulation) versus selling pressure (distribution).
- Exponential Smoothing: The raw money flow volume and the raw price volume are independently smoothed using an exponential moving average (EMA) system. The final TMF value is derived by dividing the smoothed money flow volume by the smoothed absolute volume.
- Signal Line Construction: A secondary exponential moving average is applied directly to the finalized TMF output, creating a responsive signal line to identify momentum crossovers and track the expansion or contraction of volume momentum.
● Smart Money Concepts (SMC) Architecture
The structural overlay maps the fractal nature of market trends using strict geometric logic.
- Swing Detection: The script scans historical data across a user-defined lookback period to pinpoint distinct Swing Highs and Swing Lows, creating the foundation of the market structure.
- BOS and CHoCH Logic: When the closing price breaches an active Swing High or Swing Low, the engine dynamically labels the event as a Break of Structure (BOS) if it aligns with the prevailing trend, or a Change of Character (CHoCH) if it signifies a potential trend reversal.
- Order Block Generation: Upon a confirmed structural break, the engine projects Order Blocks based on the origin of the impulse move. The depth and visual boundary of these blocks are calibrated using a localized Average True Range (ATR) calculation.
- Mitigation Tracking: The script features a state-tracking algorithm that monitors price interaction with active Order Blocks. Once price re-enters and "mitigates" a block, the zone is visually dimmed or entirely hidden, keeping the chart completely focused on unmitigated liquidity zones.
🎨 Visual Guide
● Oscillator Pane Elements
- TMF Histogram & Line: The primary TMF value is plotted as both a solid line and a supporting histogram. Values above the zero line utilize a Neon Violet color to indicate bullish money flow, while values below the zero line shift to a Neon Orange/Red to denote bearish flow.
- Signal Line: Displayed as a dotted Gold/Yellow line tracking alongside the TMF.
- Overbought/Oversold Zones: Dashed horizontal thresholds exist at user-defined overbought (+0.20) and oversold (-0.20) levels. When the TMF breaches these extremes, the background of the oscillator pane fills with a semi-transparent red or green glow.
- Alert Shapes: Small geometric shapes (triangles and circles) populate the oscillator pane to mark exact moments where the TMF crosses the zero line or breaches the outer extreme zones.
● Price Chart Overlay
- Candle Coloring: If enabled, standard price candles are re-colored based on the relationship between the TMF and its Signal Line. Bright Violet implies expanding bullish momentum, while dimmed Violet indicates narrowing bullish momentum. Conversely, Bright Orange implies expanding bearish momentum, with dimmed Orange signifying fading bearish pressure.
- Structure Labels: Dashed lines paired with small text labels (BOS / CHoCH) appear precisely where structural breaks are confirmed.
- Order Blocks: Solid rectangular boxes project forward in time. Unmitigated bullish blocks are filled with semi-transparent Violet, while unmitigated bearish blocks are filled with semi-transparent Orange. Once price touches these zones, they transition to a muted Slate/Grey color to signify mitigation.
● Real-Time Dashboard
- Positioned in the top-right corner, this dark-themed data table provides a high-level summary of the current market state. It displays the numeric TMF and Signal values accompanied by 10-segment visual power bars. It also explicitly spells out the current Momentum Gap status, Overbought/Oversold Regime, Zero Cross Age (in bars), and the overarching Market Structure trend.
📖 How to Use
● Analyzing Momentum Crossovers
- Primary trend confirmation is achieved by observing the TMF relative to the Zero Line. A sustained period above zero indicates healthy accumulation, whereas resting below zero signifies persistent distribution.
- Short-term entry triggers can be identified by the TMF crossing its dotted Gold Signal Line. An upward cross while below zero can signal an early mean-reversion opportunity, whereas an upward cross above zero confirms strong trend continuation.
● Exploiting the Mashup Confluence
- The most robust trading setups occur when both the oscillator and the price action overlay align perfectly.
- Bullish Setup: Wait for the SMC engine to print a bullish Change of Character (CHoCH) followed by the generation of a fresh, Violet Order Block. As price retraces downward into this Order Block, look at the oscillator. If the TMF is rising, crossing its Signal Line, or rejecting the oversold threshold, the probability of a successful bounce increases significantly.
- Bearish Setup: Observe price rallying into a pre-existing Orange bearish Order Block. If the dashboard simultaneously indicates that the TMF is in an "Overbought Regime" and the histogram begins crossing downward below the Signal Line, this provides confluence for a potential short entry or long exit.
⚙️ Inputs and Settings
● Calculation Parameters
- TMF Period: Determines the lookback length for the underlying money flow moving averages. Increasing this smooths the oscillator but introduces lag.
- Signal Line Period: Adjusts the sensitivity of the dotted signal line tracking the TMF.
- Overbought/Oversold Levels: Custom thresholds for extreme zones (default +/- 0.20), allowing traders to adapt the script to highly volatile or highly ranging assets.
● Neon Colors
- Total control over the aesthetic theme, including individual hex color overrides for Bullish/Rising states, Bearish/Falling states, Histogram fills, and Candle coloring.
● SMC & Market Structure
- Enable SMC Overlay: A master toggle to display or hide structural lines and Order Blocks.
- Swing Length: Dictates the strictness of pivot high/low detection. A lower number reacts to micro-trends, while a higher number identifies macro-structural shifts.
- Track / Hide Mitigated OBs: Toggles the visual state of Order Blocks after price interacts with them. Users can choose to leave them on the chart as dimmed boxes or delete them entirely for maximum chart cleanliness.
🔍 Deconstruction of the Underlying Scientific and Academic Framework
● Volumetric Price Analysis Theory
The framework of this indicator is deeply anchored in auction market theory and the foundational work of Marc Chaikin, subsequently refined by Colin Twiggs. Traditional money flow indices often fail to capture the reality of market gaps, leading to incomplete volumetric profiles. By integrating the True Range calculation, the mathematics ensure that the proportional distance between the close and the absolute extreme of the session accurately reflects the terminal buying or selling pressure.
● Exponential Smoothing Mechanics
The internal architecture relies on parallel exponential moving averages (EMA). Unlike simple averages, the EMA assigns mathematically weighted significance to the most recent data points via an alpha constant (1/N). By smoothing the price-volume product and the raw volume independently before division, the indicator mitigates the erratic noise inherent in isolated volume spikes, producing a normalized quotient that tracks the authentic underlying liquidity flow.
● Fractal Market Structure & Geometric Support
The secondary framework relies on the premise that financial markets move in fractals, creating self-similar structures across all timeframes. By programmatically defining a "Swing" as a local extremum untouched over a specified sample size, the script mathematically formalizes the identification of supply and demand origin points. The dynamic projection of Order Blocks utilizes the Average True Range (ATR) as a standard deviation metric, recognizing that liquidity zones are not precise, one-dimensional price points, but rather two-dimensional areas defined by the asset's current historical volatility.
⚠️ Disclaimer
All provided scripts and indicators are strictly for educational exploration and must not be interpreted as financial advice or a recommendation to execute trades. I expressly disclaim all liability for any financial losses or damages that may result, directly or indirectly, from the reliance on or application of these tools. Market participation carries inherent risk where past performance never guarantees future returns, leaving all investment decisions and due diligence solely at your own discretion.
Script open-source
Dans l'esprit TradingView, le créateur de ce script l'a rendu open source afin que les traders puissent examiner et vérifier ses fonctionnalités. Bravo à l'auteur! Bien que vous puissiez l'utiliser gratuitement, n'oubliez pas que la republication du code est soumise à nos Règles.

💡 Proprietary indicators. Original research. Built by analysts who trade.
📢 Free Telegram: t.me/MarkitTick_Updates
👑 Premium: TradingView Marketplace
📘 Guides: markittick.com
📢 Free Telegram: t.me/MarkitTick_Updates
👑 Premium: TradingView Marketplace
📘 Guides: markittick.com
Clause de non-responsabilité
Les informations et publications ne sont pas destinées à être, et ne constituent pas, des conseils ou recommandations financiers, d'investissement, de trading ou autres fournis ou approuvés par TradingView. Pour en savoir plus, consultez les Conditions d'utilisation.
Script open-source
Dans l'esprit TradingView, le créateur de ce script l'a rendu open source afin que les traders puissent examiner et vérifier ses fonctionnalités. Bravo à l'auteur! Bien que vous puissiez l'utiliser gratuitement, n'oubliez pas que la republication du code est soumise à nos Règles.
💡 Proprietary indicators. Original research. Built by analysts who trade.
📢 Free Telegram: t.me/MarkitTick_Updates
👑 Premium: TradingView Marketplace
📘 Guides: markittick.com
📢 Free Telegram: t.me/MarkitTick_Updates
👑 Premium: TradingView Marketplace
📘 Guides: markittick.com
Clause de non-responsabilité
Les informations et publications ne sont pas destinées à être, et ne constituent pas, des conseils ou recommandations financiers, d'investissement, de trading ou autres fournis ou approuvés par TradingView. Pour en savoir plus, consultez les Conditions d'utilisation.