Institutional Liquidity [Quantum Edge]
BY QUANTUM EDGE: Institutional Liquidity [Quantum Edge]
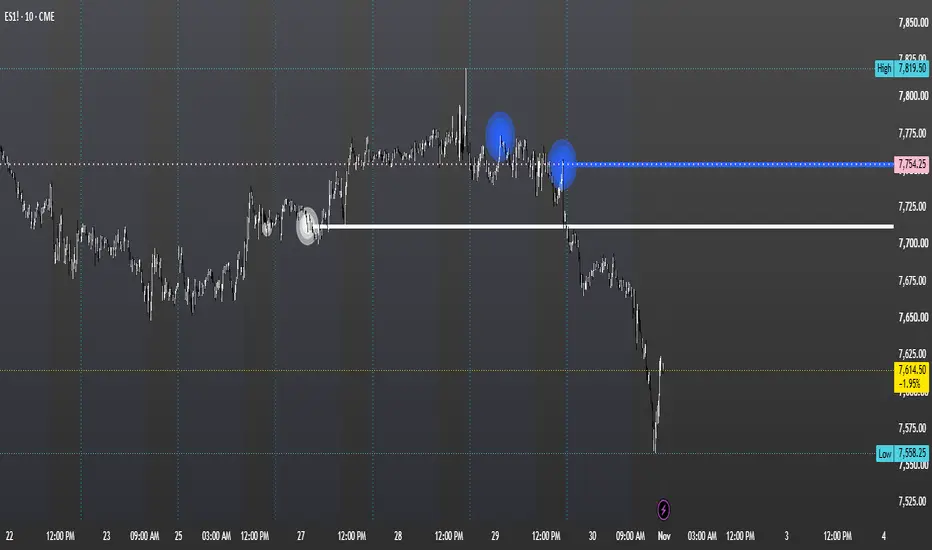
Institutional Liquidity [Quantum Edge] highlights relative-volume events following sustained close-to-close directional activity. It displays volume-scaled bubbles at qualifying candle closes and projects horizontal reference levels from recent events.
Despite its name, the indicator does not identify institutional orders, resting liquidity, or verified institutional participation. It uses chart volume and closing-price comparisons to identify conditions that may warrant further analysis.
How events are detected
The Threshold setting controls both the directional lookback and the moving-average length used to evaluate volume.
On confirmed bars, the indicator examines the most recent lookback window and sums volume into two categories:
Up-close volume: volume from candles closing above the preceding candle’s close.
Down-close volume: volume from candles closing below the preceding candle’s close.
Candles closing unchanged do not contribute to either category.
The script then checks for an absence of one category alongside above-average current-bar volume:
Buyers Activity events occur when accumulated up-close volume is zero and current volume exceeds an enabled relative-volume threshold.
Sellers Activity events occur when accumulated down-close volume is zero and current volume exceeds an enabled relative-volume threshold.
With positive volume on every bar, this generally corresponds to a non-increasing sequence of closes for Buyers Activity and a non-decreasing sequence for Sellers Activity. These names describe the indicator’s event categories—not measured buyer or seller aggression.
Relative-volume bubble sizes
Current volume is compared with its simple moving average over the Threshold length.
Bubble category Current volume requirement
Huge Greater than 2.00 × average volume
Large Greater than 1.75 × average volume
Normal Greater than 1.50 × average volume
Small Greater than 1.25 × average volume
Tiny Greater than 1.00 × average volume
Each size category can be enabled or disabled independently.
Bubble conditions overlap. For example, volume above 2.00 times its average also satisfies every lower threshold, so multiple enabled bubble sizes can appear at the same closing price.
When storing an event for a horizontal line, the script selects the highest qualifying enabled category. That category determines the line’s thickness.
Horizontal reference levels
Qualifying events are stored at the signal candle’s closing price. The indicator can display the most recent Buyers Activity and Sellers Activity levels as horizontal lines extending to the right.
Buyers Activity controls how many recent buyer-category levels are displayed.
Sellers Activity controls how many recent seller-category levels are displayed.
Each category has an independent color and enable toggle.
Display Lines controls line visibility without changing the bubble display.
Higher selected volume categories produce thicker lines.
These levels are historical event references. The script does not automatically remove them when touched, crossed, or invalidated.
Settings
Threshold
Sets the directional-analysis window and volume-average length. Default: 7; minimum: 2. Changing this setting affects both event qualification and the relative-volume baseline.
Buyers Activity / Sellers Activity
Sets the number of recent stored levels displayed for each category. The default is one level per category. Values of zero or less hide that category’s lines.
Category colors and toggles
Customize the appearance of each event category and enable or disable its detection.
Display Lines
Shows or hides horizontal event levels.
Display Bubbles
Shows or hides event bubbles.
Bubble size controls
Enable or disable Huge, Large, Normal, Small, and Tiny classifications. These controls also affect which qualifying events are stored for line drawing.
How to interpret the display
The indicator provides a way to review above-average volume occurring after a one-sided sequence of closes.
A marked level can be used as a reference when evaluating subsequent price behavior, but the event alone does not establish absorption, exhaustion, accumulation, distribution, or a reversal.
Use additional price-action and market-context criteria before treating a level as actionable. The script does not include entry confirmation, stop placement, or profit targets.
Realtime behavior and limitations
Horizontal events are recorded only on confirmed bars.
Bubble plots are not explicitly restricted to confirmed bars. During an open candle, they can appear or change as current volume and closing price update; an intrabar bubble is not necessarily a stored event.
The volume average includes the current bar.
Calculations use candle volume and close-to-close direction—not bid/ask transactions, footprint data, an order book, or actual resting orders.
Results depend on the chart’s available volume data.
The script does not classify internal versus external liquidity, confirm liquidity sweeps, or distinguish fresh from mitigated levels.
No dedicated alerts, strategy orders, position sizing, or backtest statistics are included.
For educational and analytical use only. The indicator does not guarantee institutional activity, future price direction, or profitable trading outcomes.gg
Institutional Liquidity [Quantum Edge] highlights relative-volume events following sustained close-to-close directional activity. It displays volume-scaled bubbles at qualifying candle closes and projects horizontal reference levels from recent events.
Despite its name, the indicator does not identify institutional orders, resting liquidity, or verified institutional participation. It uses chart volume and closing-price comparisons to identify conditions that may warrant further analysis.
How events are detected
The Threshold setting controls both the directional lookback and the moving-average length used to evaluate volume.
On confirmed bars, the indicator examines the most recent lookback window and sums volume into two categories:
Up-close volume: volume from candles closing above the preceding candle’s close.
Down-close volume: volume from candles closing below the preceding candle’s close.
Candles closing unchanged do not contribute to either category.
The script then checks for an absence of one category alongside above-average current-bar volume:
Buyers Activity events occur when accumulated up-close volume is zero and current volume exceeds an enabled relative-volume threshold.
Sellers Activity events occur when accumulated down-close volume is zero and current volume exceeds an enabled relative-volume threshold.
With positive volume on every bar, this generally corresponds to a non-increasing sequence of closes for Buyers Activity and a non-decreasing sequence for Sellers Activity. These names describe the indicator’s event categories—not measured buyer or seller aggression.
Relative-volume bubble sizes
Current volume is compared with its simple moving average over the Threshold length.
Bubble category Current volume requirement
Huge Greater than 2.00 × average volume
Large Greater than 1.75 × average volume
Normal Greater than 1.50 × average volume
Small Greater than 1.25 × average volume
Tiny Greater than 1.00 × average volume
Each size category can be enabled or disabled independently.
Bubble conditions overlap. For example, volume above 2.00 times its average also satisfies every lower threshold, so multiple enabled bubble sizes can appear at the same closing price.
When storing an event for a horizontal line, the script selects the highest qualifying enabled category. That category determines the line’s thickness.
Horizontal reference levels
Qualifying events are stored at the signal candle’s closing price. The indicator can display the most recent Buyers Activity and Sellers Activity levels as horizontal lines extending to the right.
Buyers Activity controls how many recent buyer-category levels are displayed.
Sellers Activity controls how many recent seller-category levels are displayed.
Each category has an independent color and enable toggle.
Display Lines controls line visibility without changing the bubble display.
Higher selected volume categories produce thicker lines.
These levels are historical event references. The script does not automatically remove them when touched, crossed, or invalidated.
Settings
Threshold
Sets the directional-analysis window and volume-average length. Default: 7; minimum: 2. Changing this setting affects both event qualification and the relative-volume baseline.
Buyers Activity / Sellers Activity
Sets the number of recent stored levels displayed for each category. The default is one level per category. Values of zero or less hide that category’s lines.
Category colors and toggles
Customize the appearance of each event category and enable or disable its detection.
Display Lines
Shows or hides horizontal event levels.
Display Bubbles
Shows or hides event bubbles.
Bubble size controls
Enable or disable Huge, Large, Normal, Small, and Tiny classifications. These controls also affect which qualifying events are stored for line drawing.
How to interpret the display
The indicator provides a way to review above-average volume occurring after a one-sided sequence of closes.
A marked level can be used as a reference when evaluating subsequent price behavior, but the event alone does not establish absorption, exhaustion, accumulation, distribution, or a reversal.
Use additional price-action and market-context criteria before treating a level as actionable. The script does not include entry confirmation, stop placement, or profit targets.
Realtime behavior and limitations
Horizontal events are recorded only on confirmed bars.
Bubble plots are not explicitly restricted to confirmed bars. During an open candle, they can appear or change as current volume and closing price update; an intrabar bubble is not necessarily a stored event.
The volume average includes the current bar.
Calculations use candle volume and close-to-close direction—not bid/ask transactions, footprint data, an order book, or actual resting orders.
Results depend on the chart’s available volume data.
The script does not classify internal versus external liquidity, confirm liquidity sweeps, or distinguish fresh from mitigated levels.
No dedicated alerts, strategy orders, position sizing, or backtest statistics are included.
For educational and analytical use only. The indicator does not guarantee institutional activity, future price direction, or profitable trading outcomes.gg

Clause de non-responsabilité
Les informations et publications ne sont pas destinées à être, et ne constituent pas, des conseils ou recommandations financiers, d'investissement, de trading ou autres fournis ou approuvés par TradingView. Pour en savoir plus, consultez les Conditions d'utilisation.
Clause de non-responsabilité
Les informations et publications ne sont pas destinées à être, et ne constituent pas, des conseils ou recommandations financiers, d'investissement, de trading ou autres fournis ou approuvés par TradingView. Pour en savoir plus, consultez les Conditions d'utilisation.