OI Candle by Umut
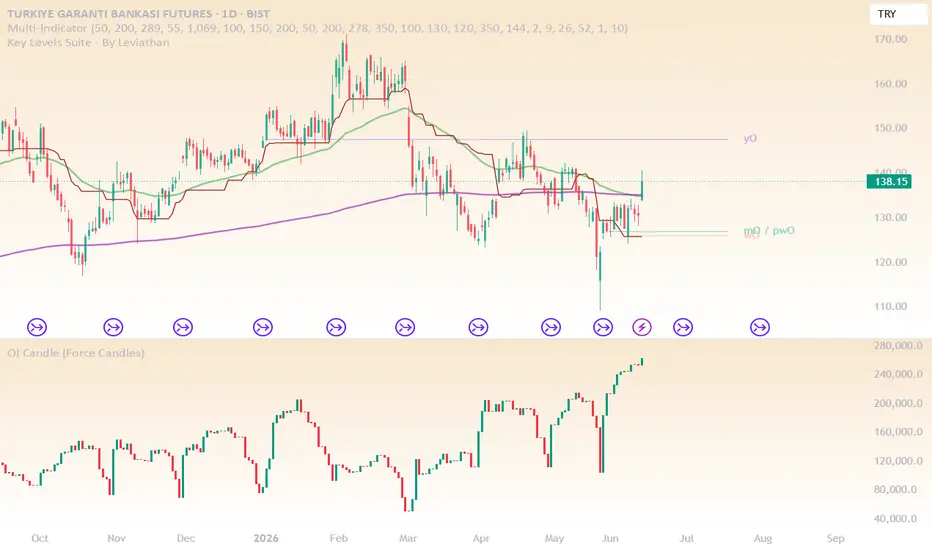
This indicator displays Open Interest (OI) as candlestick data across all timeframes, giving traders a clearer view of market participation and positioning dynamics.
Unlike standard OI indicators that use line charts or are limited to higher timeframes, this version visualizes OI using full OHLC candles. This allows you to analyze volatility, momentum, and structural changes in open interest in the same way as price action.
Unlike standard OI indicators that use line charts or are limited to higher timeframes, this version visualizes OI using full OHLC candles. This allows you to analyze volatility, momentum, and structural changes in open interest in the same way as price action.

Clause de non-responsabilité
Les informations et publications ne sont pas destinées à être, et ne constituent pas, des conseils ou recommandations financiers, d'investissement, de trading ou autres fournis ou approuvés par TradingView. Pour en savoir plus, consultez les Conditions d'utilisation.
Clause de non-responsabilité
Les informations et publications ne sont pas destinées à être, et ne constituent pas, des conseils ou recommandations financiers, d'investissement, de trading ou autres fournis ou approuvés par TradingView. Pour en savoir plus, consultez les Conditions d'utilisation.