OPEN-SOURCE SCRIPT
PMH / PML Each Day
# PMH / PML Each Day Levels
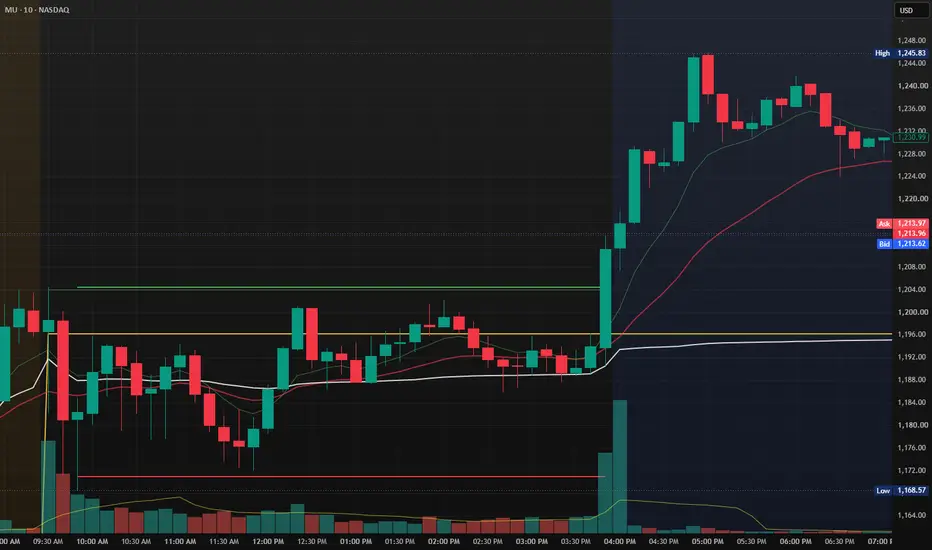
This indicator automatically plots the **Previous Market High (PMH)** and **Previous Market Low (PML)** for every trading day using **Regular Trading Hours (RTH)** only.
### Features
* Plots the Previous Market High (PMH) and Previous Market Low (PML) for every trading session.
* Uses only **9:30 AM – 4:00 PM (Regular Market Hours)**.
* Draws historical PMH/PML levels for every day, making it ideal for backtesting.
* Each day's levels are displayed independently and do not overwrite previous sessions.
* Clean horizontal lines help identify important support and resistance levels.
* Works across all intraday timeframes.
* Perfect for price action, ORB, liquidity sweeps, and breakout/reversal strategies.
### Ideal For
* Intraday traders
* Opening Range Breakout (ORB) traders
* Support & Resistance analysis
* Historical chart review and backtesting
* Liquidity and market structure traders
This indicator provides a simple and reliable way to visualize the previous day's key market levels, allowing traders to quickly identify areas where price may react during the current trading session.
This indicator automatically plots the **Previous Market High (PMH)** and **Previous Market Low (PML)** for every trading day using **Regular Trading Hours (RTH)** only.
### Features
* Plots the Previous Market High (PMH) and Previous Market Low (PML) for every trading session.
* Uses only **9:30 AM – 4:00 PM (Regular Market Hours)**.
* Draws historical PMH/PML levels for every day, making it ideal for backtesting.
* Each day's levels are displayed independently and do not overwrite previous sessions.
* Clean horizontal lines help identify important support and resistance levels.
* Works across all intraday timeframes.
* Perfect for price action, ORB, liquidity sweeps, and breakout/reversal strategies.
### Ideal For
* Intraday traders
* Opening Range Breakout (ORB) traders
* Support & Resistance analysis
* Historical chart review and backtesting
* Liquidity and market structure traders
This indicator provides a simple and reliable way to visualize the previous day's key market levels, allowing traders to quickly identify areas where price may react during the current trading session.
Script open-source
Dans l'esprit TradingView, le créateur de ce script l'a rendu open source afin que les traders puissent examiner et vérifier ses fonctionnalités. Bravo à l'auteur! Bien que vous puissiez l'utiliser gratuitement, n'oubliez pas que la republication du code est soumise à nos Règles.

Clause de non-responsabilité
Les informations et publications ne sont pas destinées à être, et ne constituent pas, des conseils ou recommandations financiers, d'investissement, de trading ou autres fournis ou approuvés par TradingView. Pour en savoir plus, consultez les Conditions d'utilisation.
Script open-source
Dans l'esprit TradingView, le créateur de ce script l'a rendu open source afin que les traders puissent examiner et vérifier ses fonctionnalités. Bravo à l'auteur! Bien que vous puissiez l'utiliser gratuitement, n'oubliez pas que la republication du code est soumise à nos Règles.
Clause de non-responsabilité
Les informations et publications ne sont pas destinées à être, et ne constituent pas, des conseils ou recommandations financiers, d'investissement, de trading ou autres fournis ou approuvés par TradingView. Pour en savoir plus, consultez les Conditions d'utilisation.